
Explore Categories
AGILE
View all CoursesAGILE
SAFe
View all CoursesSAFe Category
PROJECT
View all CoursesPROJECT
BUSINESS
View all CoursesBUSINESS
Generative AI
View all CoursesMicrocredentials
View all CoursesUnlock your Potential and Boost your Career Prospects with our Agile Microcredentials Program.
DATA SCIENCE
View all CoursesDATA SCIENCE
QUALITY
View all CoursesQUALITY
On Demand Microcredentials
View all CoursesOn Demand Microcredentials Category
DEVOPS
View all CoursesDEVOPS
TECHNOLOGY
View all CoursesTECHNOLOGY
SERVICE
View all CoursesSERVICE
Cloud Computing
View all CoursesCertified with best cloud computing courses online to boost up your career growth | Simpliaxis
OTHERS
View all CoursesOTHERS
Six Sigma Black Belt Certification Course
Lean Six Sigma Black Belt Certification Training Program in USA
Advance Process Excellence Skills with Lean Six Sigma Black Belt certification
1.5K+ Enrolled
Accredited by
Accredited by
Six Sigma Black Belt Certification Course
Six Sigma Black Belt Certification Course
Advance Process Excellence Skills with Lean Six Sigma Black Belt certification
Credential issued by
Guaranteed to Run Workshops
Expert-Led Study Sessions
Networking Opportunities
Flexible Monthly Payment Plans
Real-World Case Studies
Hands-On Project Experience
450K+
Professionals trained
250+
Workshops every month
30+
Trainers
1.5K+ Enrolled

5% OFF
Coupon code "POP5"
Expires Next Tuesday
450K+
Professionals trained
250+
Workshops every month
20+
Trainers
Course Overview
Boost your process excellence skills with the Lean Six Sigma Black Belt (LSSBB) certification course. This program positions you as a strategic leader capable of delivering measurable business impact and is a proven accelerator for long-term professional growth. This training program offered by Simpliaxis builds advanced capability in the DMAIC framework and helps participants define business problems clearly, measure performance accurately, analyze root causes using statistical methods, implement optimized solutions, and sustain results through effective controls.
The Lean Six Sigma Black Belt is an advanced program designed to develop experts who lead complex, cross-functional improvement projects. The training focuses on DMAIC concepts, advanced statistical tools, and lean techniques and helps professionals solve critical business problems. The course prepares professionals for senior leadership roles in quality, process excellence, and continuous improvement.
The LSSBB certification validates your ability to lead complex, enterprise-level improvement initiatives. Black Belts also act as change leaders who drive tangible results, improve efficiency, and allow fact-based, statistical decision-making.
Our Lean Six Sigma Black Belt certification training program includes comprehensive DMAIC coverage, Lean waste elimination tools, advanced statistical analysis, and real-world project application. Learners gain hands-on experience with hypothesis testing, regression, DOE, SPC, and financial validation, along with leadership, stakeholder management, and exam-focused preparation aligned with global certification standards.
The Lean Six Sigma Black Belt training helps participants develop the following skills:
The Lean Six Sigma Black Belt course includes a comprehensive set of DMAIC, Lean, and advanced statistical tools such as
At Simpliaxis, we offer Lean Six Sigma Black Belt certification training through live instructor-led virtual classes, flexible self-paced online learning, and corporate group sessions. These sessions combine guided training with hands-on project support.
Lean Six Sigma Black Belt Training Highlights
Comprehensive DMAIC methodology and advanced statistics coverage
35 hours of Instructor-led training
Earn 65 PDUs
Flexible self-paced digital learning options
Two-phase model combining theory and applied project work
Mock quizzes and real data analysis practice
Expert mentorship throughout project execution
Support for certification exam readiness and documentation
Advanced Tools & Methodologies

Career upliftment
By the end of the Six Sigma Black Belt course, participants will be able to:
Unsure about your prep?
Benefits focused on Individuals and corporate
Improved Career Growth and Leadership Opportunities: Lean Six Sigma Black Belt certification strengthens professional credibility and prepares individuals for leadership roles in quality management, process improvement, and operational excellence.
Advanced Problem-Solving and Analytical Skills: The Lean Six Sigma Black Belt training develops expertise in DMAIC methodology, advanced statistical analysis, and root cause identification.
Higher Earning Potential and Professional Recognition: Certified Lean Six Sigma Black Belt professionals receive higher salaries due to their ability to drive tangible performance improvements and deliver sustainable business results.
Global Recognition Across Industries: Lean Six Sigma Black Belt certification is widely recognized in manufacturing, healthcare, IT, finance, and supply chain sectors and improves employability and career mobility worldwide.
Strong Project and Change Management Skills: The Lean Six Sigma Black Belt certification develops project leadership and change management capabilities and allows professionals to lead cross-functional teams.
Improved Operational Efficiency: Lean Six Sigma Black Belt certified professionals help organizations to streamline processes, eliminate waste, reduce cycle times, and achieve higher productivity.
Cost Reduction and ROI Improvement: Lean Six Sigma Black Belt professionals identify inefficiencies, minimize rework, and optimize resources to deliver tangible cost savings and a strong return on investment.
Improved Quality and Process Consistency: Professionals with Lean Six Sigma Black Belt certificationfocus on reducing variation and defects to help businesses achieve stable processes, improved quality standards, and predictable outcomes.
Stronger Leadership and Change Management: Black Belt certification develops professionals who can lead cross-functional teams, manage change effectively, and drive continuous improvement initiatives across the organization.
Scalable Continuous Improvement Culture: Organizations benefit from a structured improvement framework that supports long-term growth, innovation, and enterprise-wide adoption of Lean Six Sigma best practices.
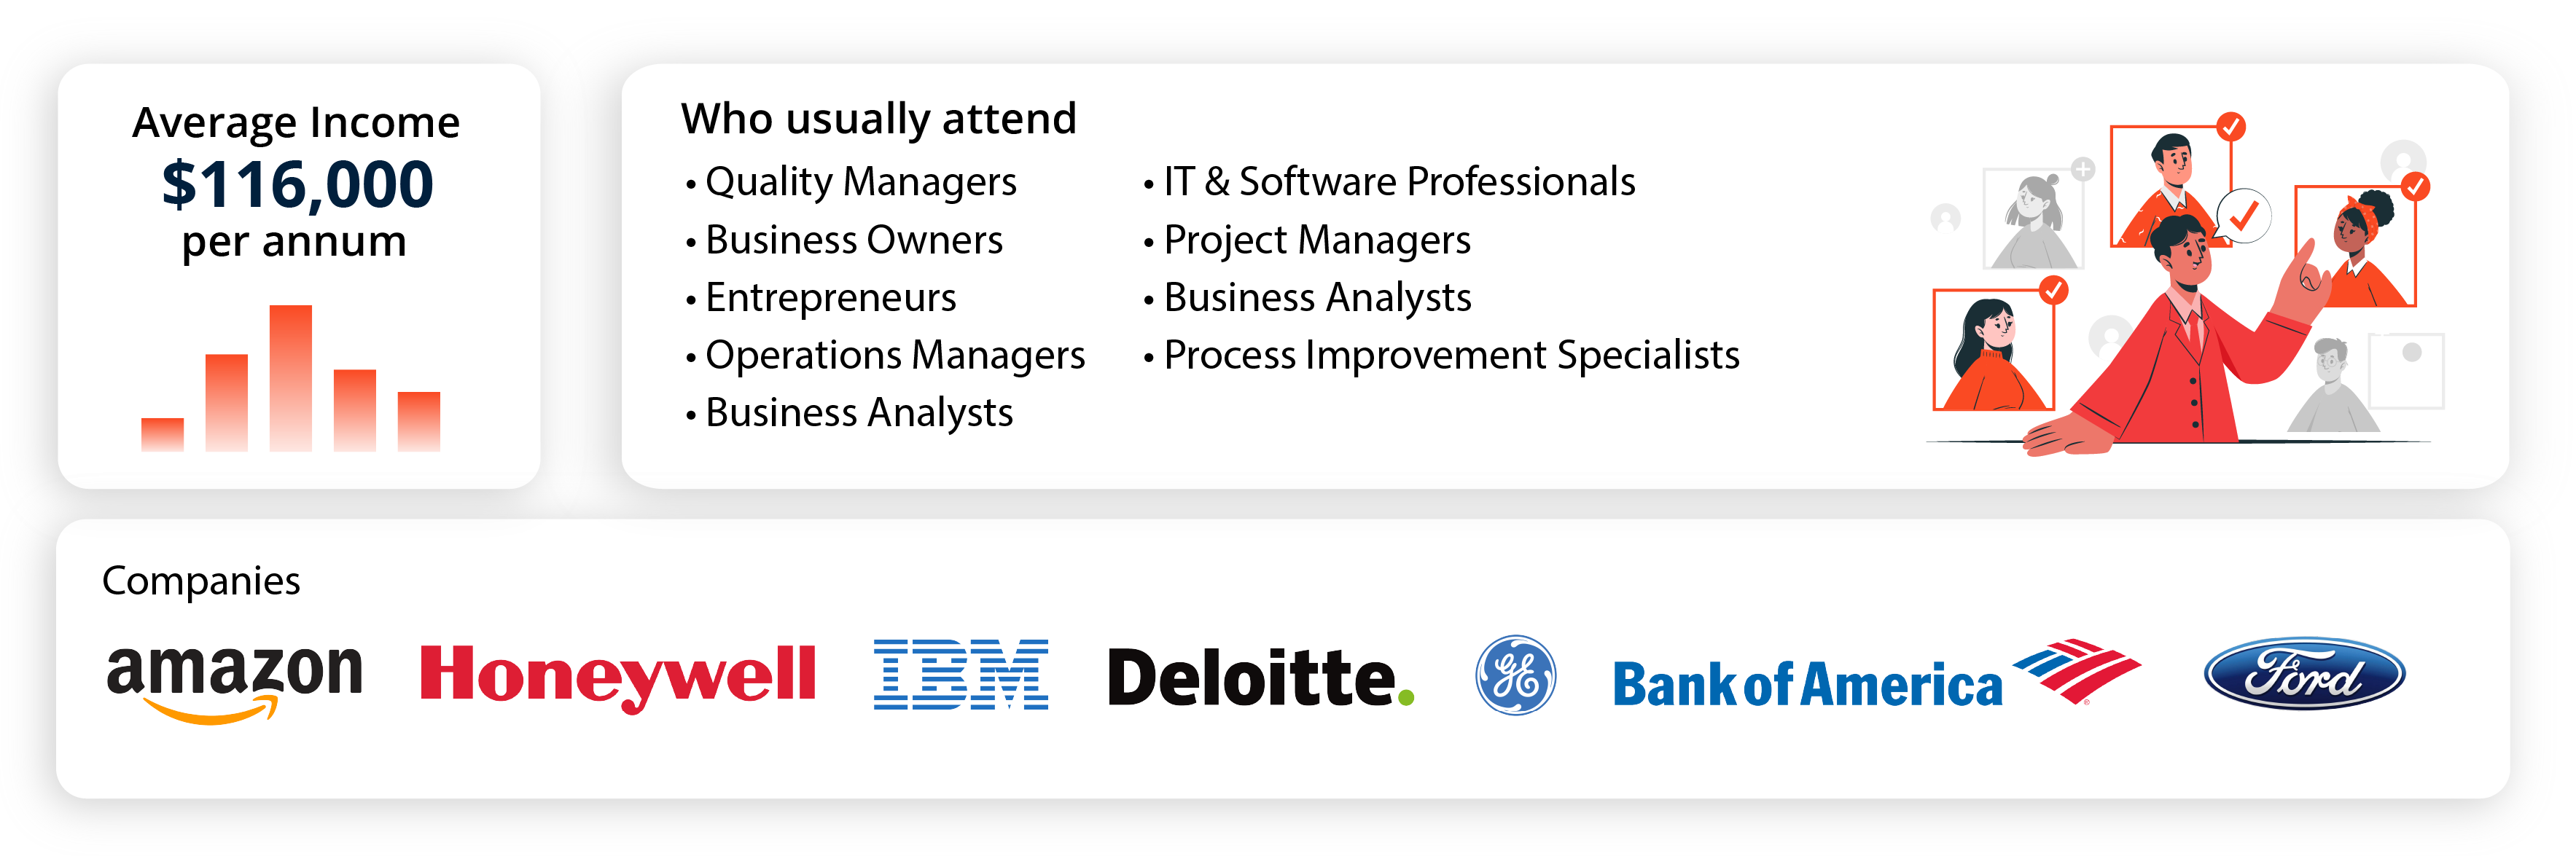
Common attendees
The Lean Six Sigma Black Belt training program is suitable for professionals who lead process improvement, quality management, and operational excellence initiatives. It is especially relevant for individuals such as
Quality & Operations Professionals
Manufacturing & ITES/IT Professionals
Healthcare & BFSI Professionals
Aviation Industry Professionals
Project Managers
Continuous Improvement Leaders
Professionals Aiming for Senior Leadership or Consulting Roles
Prerequisites for Lean Six Sigma Black Belt certification training
The Lean Six Sigma Black Belt certification requires prior foundational knowledge and practical experience in process improvement methodologies. It includes
Get the Lean Six Sigma Black Belt Certification


Curriculum
Define Phase
Measure Phase
Analyze Phase
Improve Phase
Control Phase
Course Curriculum
Define Phase
Measure Phase
Analyze Phase
Improve Phase
Control Phase
What you will learn in this Lean Six Sigma Black Belt workshop
By the end of the Lean Six Sigma Black Belt training program, participants gain expertise to
Lead Cross-Functional DMAIC Improvement Projects:
Manage complex DMAIC initiatives across departments, align stakeholders, and drive structured problem-solving to get continuous process improvements.
Apply Advanced Lean Six Sigma and Statistical Tools:
Use advanced statistical analysis and Lean methodologies to identify root causes, minimize variation, and optimize end-to-end business processes.
Deliver Tangible Financial and Operational Results:
Translate improvement initiatives into quantifiable cost savings, productivity gains, and improved operational performance.
Train Green Belts and Influence Leadership Teams:
Mentor Green Belts, guide project execution, and communicate insights that help leadership make informed, data-driven decisions.
Sustain Process Improvements with Control Systems:
Implement monitoring tools, standard controls, and performance metrics to ensure long-term stability and continuous improvement.
40+ Certification programs made an impact
Employee retention improved by 45%
Work satisfaction and capabilities improved by 30% on an average
100+
Clients


Lean Six Sigma Black Belt Certification Course For Corporates
With learning targeted to your unique team environment, we at SimpliAxis help to resolve your specific issues and meet your specific needs with tailored training methods. We offer corporate training globally to keep Organizations up to date by building the knowledge gap required and make them strive in the competitive world with the right skills according to the industry needs.
Our Customer words for us


Meet the Team That's Invested in Your Success

Aakash Srinivasan, CST
Experience: 15+ Years
Certified Scrum Master (CSM®), Certified Scrum Product Owner (CSPO®)

Michel Goldenberg, CST
Experience: 21+ Years
Certified Scrum Master (CSM®), Advanced Certified Scrum Master (ACSM®)...

Raj Kasturi, CST
Experience: 28+ Years
CSM

Abid Quereshi, CST
Experience: 25+ Years
Certified Scrum Master (CSM®), Advanced Certified Scrum Master (ACSM®)...

Vivek Angiras, CST
Experience: 15+ Years
Certified Scrum Master (CSM®), Certified Scrum Product Owner (CSPO®)...

Bill Li
Experience: 23+ Years
CSM, CSPO and A-CSM
What is Lean Six Sigma Black Belt training?
Who should enroll in Lean Six Sigma Black Belt certification?
What skills will I gain from Lean Six Sigma Black Belt training?
What are the prerequisites for the Lean Six Sigma Black Belt program?
How long does it take to complete Lean Six Sigma Black Belt training?
Is the Lean Six Sigma Black Belt exam difficult?
What is the format of the Lean Six Sigma Black Belt certification exam?
Is Lean Six Sigma Black Belt certification globally recognized?
What career benefits does Lean Six Sigma Black Belt certification offer?
Is Black Belt certification worth it?
What are the topics covered in Lean Six Sigma Black Belt training?
What is the validity period of Lean Six Sigma Black Belt certification?
Does Simpliaxis provide practice test papers for the Black Belt certification exam?
What is the exam format for Lean Six Sigma Black Belt certification?
How many exam attempts are allowed?
How many PDUs will I earn?
What certificate will I receive?
When will I receive my certificate?
What job opportunities are there for Lean Six Sigma Black Belt-certified professionals?
What happens to my token or partial payment if I don’t enroll immediately?
Is there a preferred currency for payment, especially for international students?
Can payments be made online through your website, or do I need to visit a physical location?
Do you offer any discounts or promotions for early payment?
Can I pay for the course in installments, or is full payment required upfront?
Will I get a refund if I cancel my enrollment?
Where will I get my payment receipt?
Is there any transaction or processing fee?
What cards do you accept?
What payment options are available?
What if I miss a class? Are there any money back options?
If I want to know more about Training, whom should I connect with?
Is there any option to complete the Training in the native language if a participant chooses to?
Can I receive personalized Training at my convenience?
Where do I find the upcoming schedules of my course?
After enrollment, can I change the date of my training class?
Do I get any certificate upon completion of the course?
How do I enroll in the training course?
What are the different courses offered by Simpliaxis?
What are the different modes of Training available for Simpliaxis courses?
Do you offer online Training?
Do you offer corporate Training?
Who are the instructors of my course?
Is there any discount available for the Simpliaxis courses?
Whom do I contact if I have more queries regarding my course?
Are your courses affordable?
Why should I choose Simpliaxis?
What is the object of Simpliaxis?
How much discount will I get if I enroll for the Training?
Lean Six Sigma Black Belt Course FAQs
Training covers the following topics:
The exam format is as follows:
According to the IASSC retake policy:
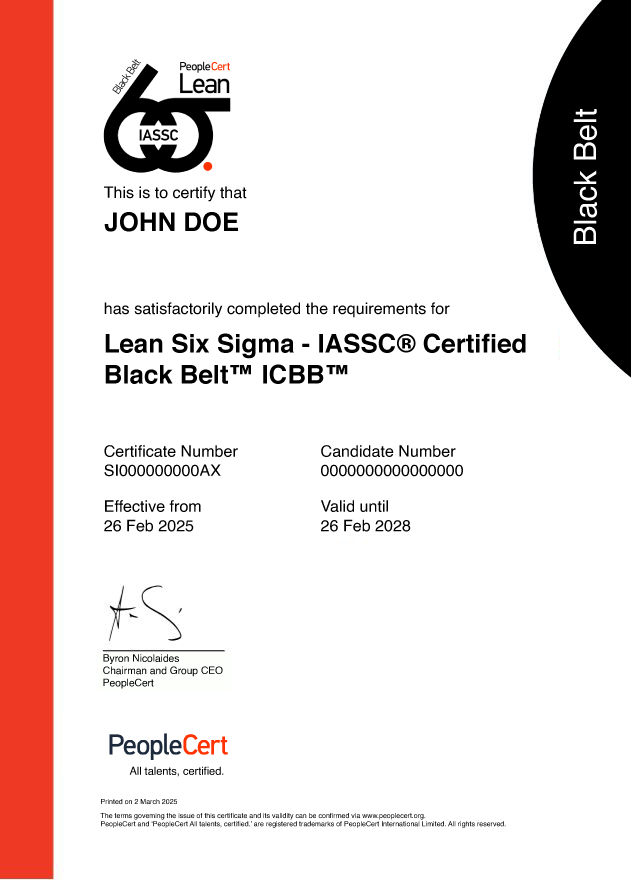
Certification
Upon successfully passing the certification examination, candidates are awarded the IASSC Certified Lean Six Sigma Green Belt certification by IASSC.Training Attendance
SimpliAxis issues a Letter of Attendance to all participants who successfully complete the training program, confirming their participation in the instructor-led course.
There are various job roles such as;
Industries include Manufacturing, Healthcare, Banking, IT, Logistics, Consulting, and Retail.
You can reach out to our experienced career counselor
or email us on support@simpliaxis.com
or contact any of our phone numbers
or you can chat with us anytime
or visit our contact us page https://www.simpliaxis.com/contact-us
Find out why 1,000+ professionals love SimpliAxis
_1777381074.png)
Daniel Harper
Product Manager
Outstanding training from Simpliaxis! The curriculum on multi-agent architectures and RAG pipeline development using Claude was thorough and current. Real-world use cases across industries gave me the confidence to lead AI initiatives at my organization immediately.
_1777380840.png)
Sarah Mitchell
Cloud AI Architect
I enrolled in this course to upskill as a software architect, and Simpliaxis exceeded my expectations. The MCP server integration labs and Claude API demos were practical and industry-relevant. The trainer's mentorship made complex agentic concepts easy to grasp.
_1777380306.png)
Priya Venkataraman
AI Solutions Architect
The hands-on labs in Simpliaxis's Agentic AI Engineering course were brilliant. From context engineering to building RAG applications with Langflow, every module was structured and practical. The trainers were knowledgeable and always available for 1:1 support.

James O'Brien
Technical Lead
Simpliaxis's Agentic AI Engineering with Claude course was a game-changer. The 48-hour live sessions covering RAG, LangChain, and multi-agent systems were incredibly hands-on. I went from theory to deploying a production-grade AI agent within weeks. Highly recommended!
_1777377906.png)
Arjun Krishnamurthy
AI/ML Engineer
Simpliaxis delivered exceptional value through this Agentic AI Engineering course. Building autonomous agents with Claude SDK, integrating MCP servers, and deploying on cloud platforms gave me skills that no other training provided. My career in AI has taken a huge leap forward.

Jai Kumar Jadhav
I’m happy to share that I’ve obtained a new certification: Certified Scrum Product Owner (CSPO) from Scrum Alliance🙏 A heartfelt thank you to Simpliaxis for a well-structured training experience and to our amazing Naveen Nanjundappa for thoroughly covering the CSPO concepts and making the learning engaging and practical
Industry-Recognized Certification
Simpliaxis offers a globally recognized Lean Six Sigma Black Belt certification aligned with Global Body & industry standards operational excellence practices.
Expert-Led Training by Certified Practitioners
We deliver the Lean Six Sigma Black Belt training by experienced professionals with real-world industry exposure.
Comprehensive and Structured Curriculum
Simpliaxis offers a well-structured Lean Six Sigma Black Belt course covering DMAIC methodology, Lean tools, and advanced statistical techniques, and it ensures a strong conceptual foundation.
Hands-On Projects and Practical Case Studies
Our Lean Six Sigma Black Belt certification course includes real-world projects and case studies to help learners apply Lean Six Sigma concepts effectively.
Exam-Focused Training and Certification Support
The Lean Six Sigma Black Belt training is designed to closely align with the certification exam structure, including exam preparation support, practice questions, and guidance.
Career-Oriented Skill Development
Our LSSBB course focuses on building leadership, analytical, and project management skills for senior roles and helps professionals advance their careers in quality, operations, and process excellence.
Coverage of Advanced Statistical Tools
We focus on advanced statistical analysis, such as hypothesis testing, regression analysis, etc., to allow learners to make data-driven decisions and deliver measurable business improvements.
Dedicated Learning Support and Resources
Simpliaxis offers comprehensive learning materials, expert support, and post-training assistance to help participants receive continuous guidance throughout training and beyond.


Thank you!
We’ve successfully received your request.
Our Learning Advisor will reach out to you shortly.

Our privacy policy © 2018-2026, Simpliaxis Solutions Private Limited. All Rights Reserved