


 Call Us



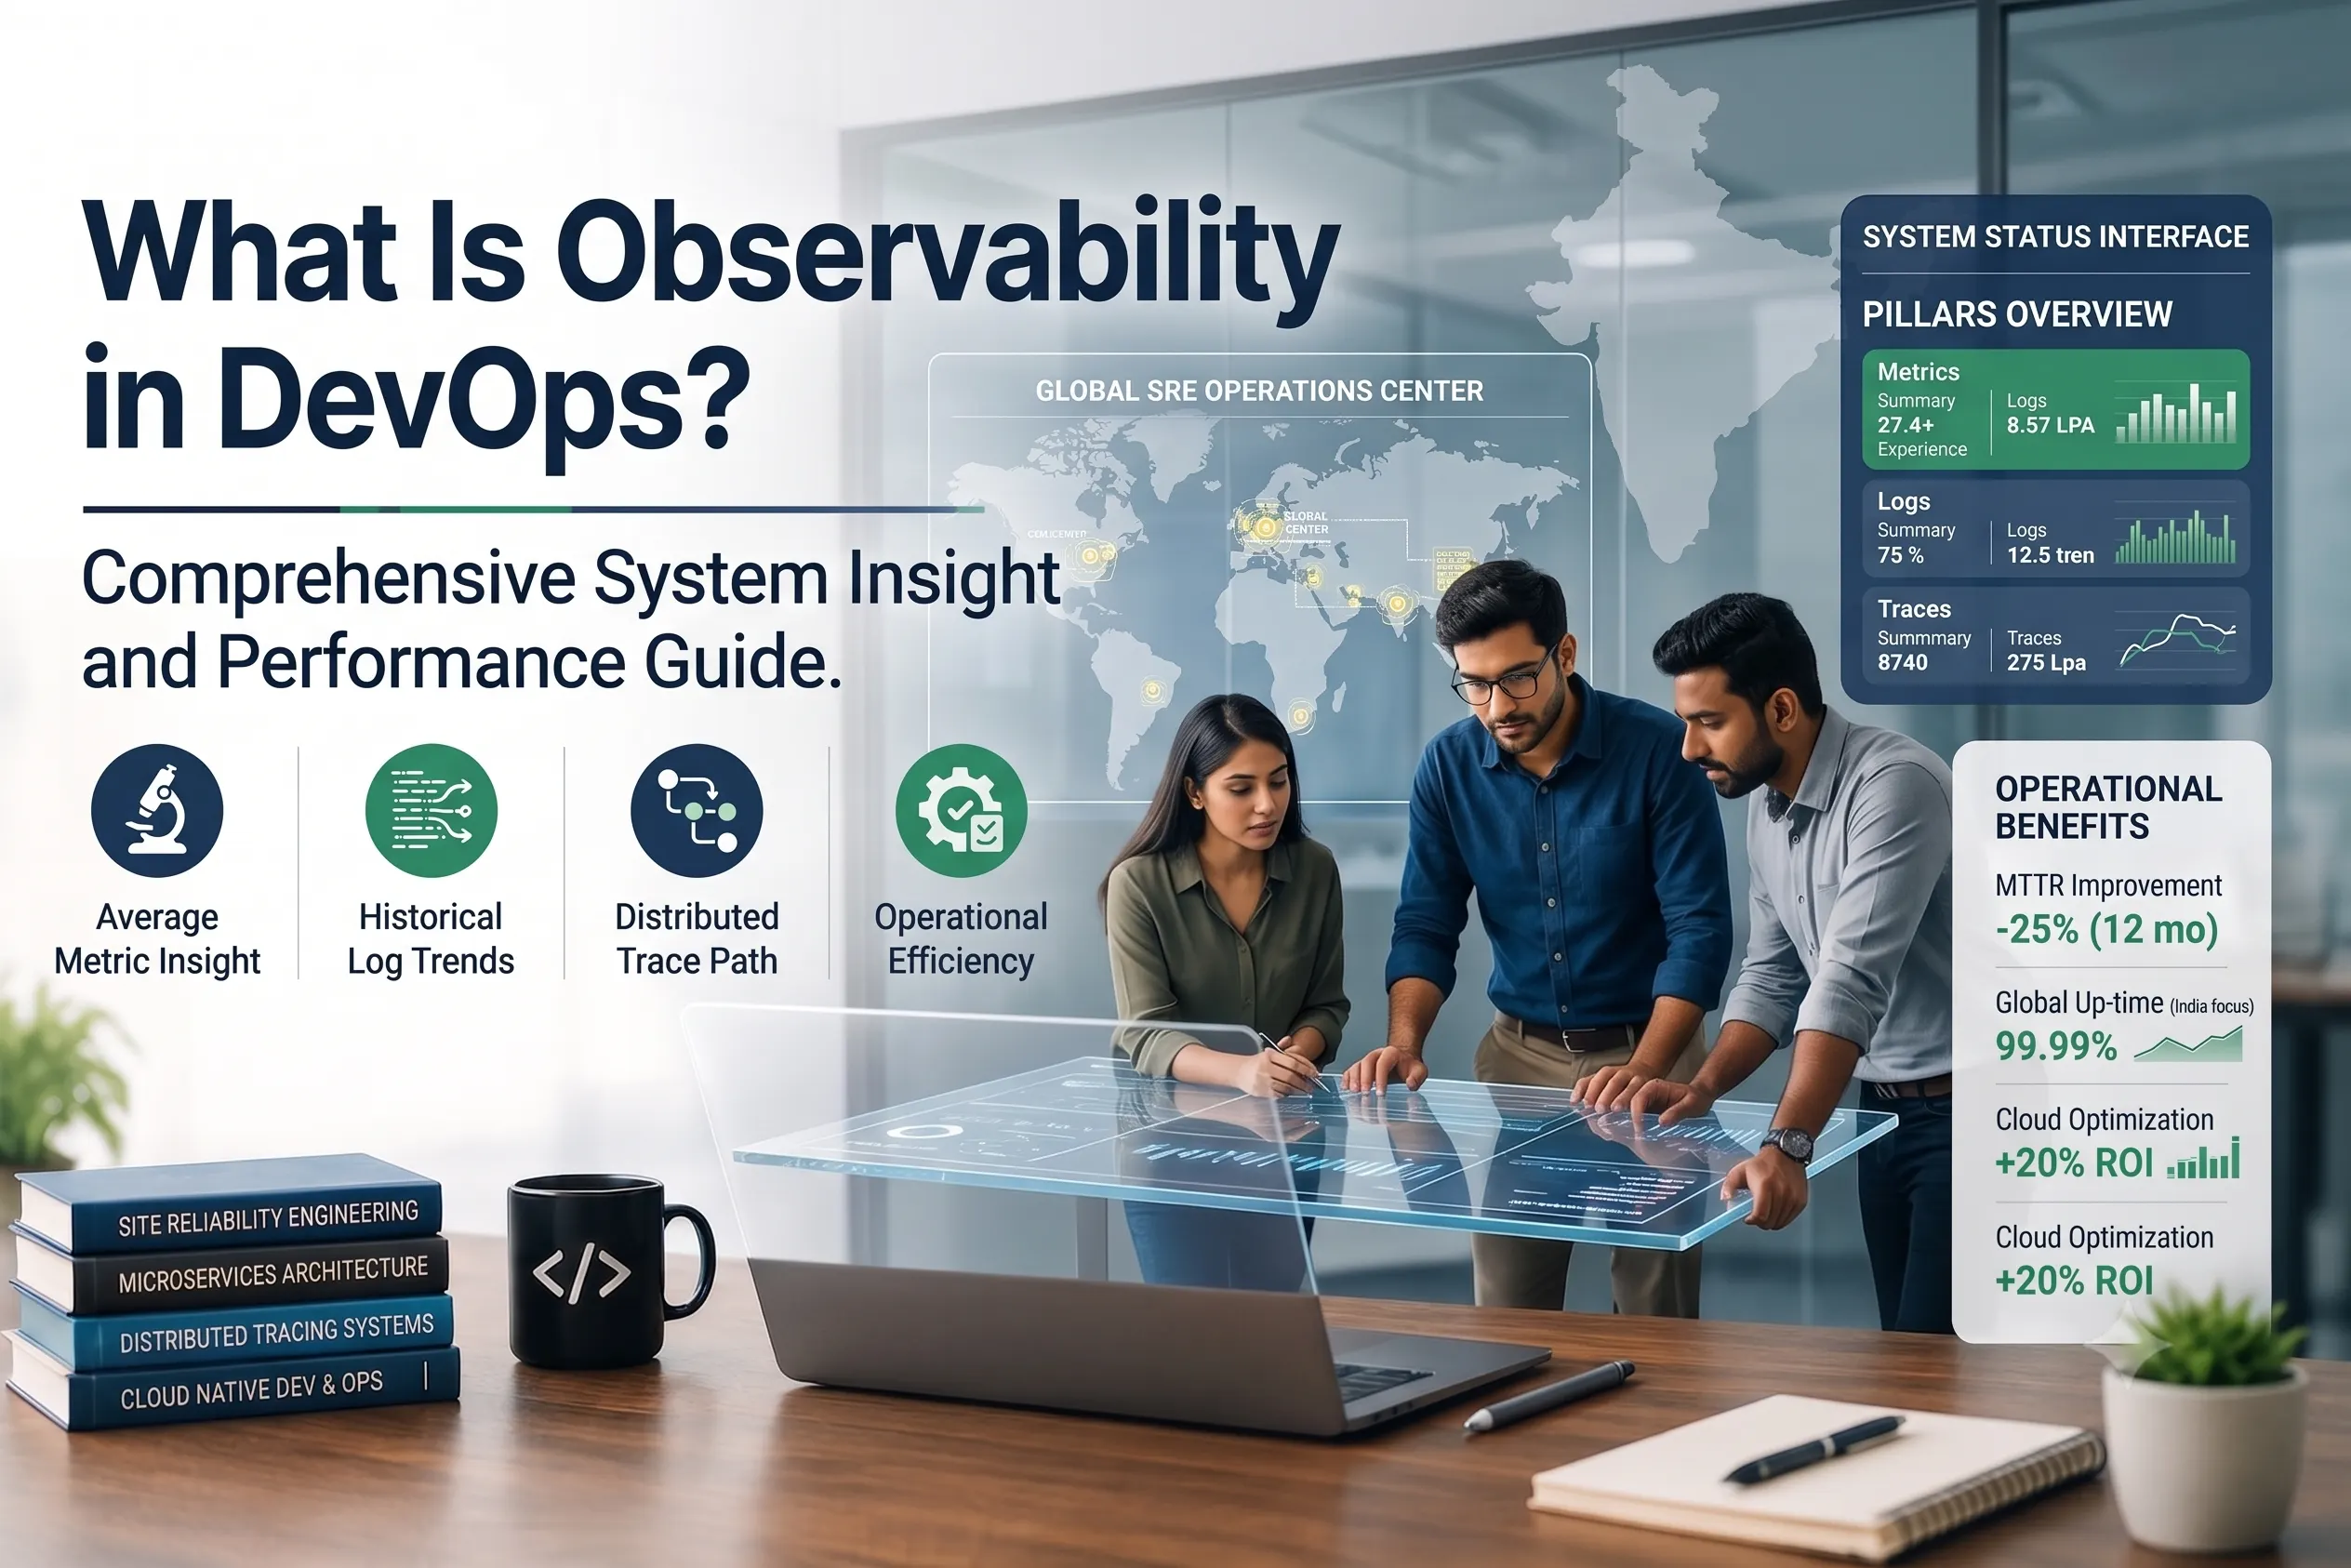
Observability in DevOps is the technique of gathering and utilizing data from applications, infrastructure, and services to understand how a system is doing. This is increasingly seen in cloud and Agile contexts.
Agile teams are meant to provide changes fast and react to feedback. Cloud environments also feature various short-lived resources, containers, services, and dependencies. As the system expands, it is more difficult to understand what is occurring within it without adequate visibility. Observability creates such visibility.
It’s not another dashboard or another set of warnings. Best practice for observability is to link system data to the questions engineers need to answer. For instance:
- What triggered the spike in response time following a deployment?
- Which service is not responding to a request?
- Why do only certain users get an error?
- The database is not a bottleneck.
- Is the issue a configuration modification problem?
- Where is most of the time being spent in the dispersed request?
- Does the problem occur just for one service, area, environment, or version?
A useful observability configuration provides engineers the knowledge they need to answer these issues without guessing or searching through irrelevant data. It also serves a larger DevOps purpose: speeding software delivery without sacrificing dependability.
What Are the Key Differences Between Observability and Monitoring?
Observability and monitoring are linked, but they’re not quite the same thing.
Most monitoring involves observing known circumstances. The teams choose the signals that matter, thresholds, or alert criteria and are notified when they are satisfied. Monitoring helps to answer issues such as, "Is a service available?" Is CPU utilization too high? Has the error rate risen over a specific level?
Observability is more than that. This gives teams enough information to study the system's behavior, including issues they did not anticipate. Let’s take a basic example to make the distinction obvious. What happens when a website is slow? The monitoring system might indicate that average reaction time has grown from 300 milliseconds to 900 milliseconds. This is useful since it tells the team that performance has been altered. But the team still has to figure out why.
With observability, they may tie the slow response back to a specific request, service, database process, problem, deployment, or infrastructure event. A trace may show that a database call is consuming most of the time used to handle the request. There might be some database connection failures in certain related logs. Metrics may suggest that the connection pool is approaching its limit.
Monitoring helps to pinpoint the issue; observability helps to examine it. Monitoring is outmoded and unneeded. Observability is still very much monitoring-centric. Things like warnings, dashboards, thresholds, service health checks, and known failure conditions for day-to-day work are also needed.
The main difference is the volume of data and the ability to go further.
Monitoring is frequently requested:
"What's the matter?"
Observability answers:
“What’s happening? Why is it happening? And what else is affected?”
Google’s Site Reliability Engineering guideline also emphasizes the need for monitoring for alerts, dashboards, long-term trends, and debugging. Latency, traffic, errors, and saturation are its four well-known golden signals.
So for DevOps teams, the two processes should complement each other and not compete.
Talk To an ExpertWhat Are the Three Observability Pillars?
Logs, metrics, and traces are sometimes referred to as the three observability pillars of observability. The three main observability signals are metrics, logs, and traces. Each signal delivers distinct information.
Logs
Logs are the history of what occurs in an application, service, or system.
A log may show a request failed, a user logged in, a database connection was made, a deployment started, or an application reported an error.
Logs are important when engineers require a lot of detail on a single occurrence.
For example, a log may include:
- Event date
- Service name
- Environment
- Error severity
- Error message
- Request identifier
- Trace ID
- Version of the application
- Further Useful Context
In current systems, structured logs are particularly important since they are more readily searchable and filterable. It also enables you to correlate logs with trace and span information, thereby facilitating navigation from a trace to the logs associated with the same request.
But merely having many logs doesn’t mean you are highly observable. Inconsistent logs, logs with no context, and logs with unclear claims may take engineers a lot of effort to understand. Perfect logging should answer meaningful queries without generating useless data.
Metrics
Metrics are numerical data that are gathered over time.
Such as:
- Request rate
- Error rate
- Response time
- CPU usage
- Memory usage
- Disk usage
- Network traffic
- Queue length
- Number of active users
- Database connection usage
Metrics are useful for seeing patterns and swiftly recognizing changes. They are also often used for alerting, since numeric data may be compared to predicted ranges or thresholds.
For example, a team could see that the number of requests is constant, yet latency has grown. That combination might be a useful hint.
Another effective method to think about key metrics of a system is to utilize Google’s four golden signals:
- Latency: Time required to process requests.
- Traffic: How much demand is the system getting
- Errors: Number of requests or activities that are failing
- Saturation: Degree to which a restricted resource is being used
Metrics are often small compared to raw logs, which makes them good for dashboards and long-term trend monitoring.
Traces
Traces keep track of requests across distributed systems.
Picture a consumer landing on a product page. The request may pass via a front-end service, API, authentication service, product service, database, and another external service. This voyage may be represented as a trail of operations. A distributed trace is a set of spans that collectively indicate the path of a request via multiple portions of a system. This is particularly helpful when there are several services in a system.
An engineer may track one request and observe where time was spent, instead of looking at each service independently.
For example:
- The request reached the API in 100 ms.
- The API is called the product service.
- The product service responded quickly.
- The product service then called the database.
- The database query took 2.5 seconds.
- The trace now gives the engineer a strong lead.
Without tracing, the engineer might have to check several services and logs separately.
Why Do the Three Signals Work Better Together?
Logs, metrics, and traces are just various aspects of the same issue.
- Metrics may indicate something has changed.
- Traces will show where the request was impacted.
- Logs can show what was going on at that moment.
The true value is in linking these signals together.
That’s why current observability isn’t about gathering more data. This is about gathering meaningful data and enabling similar information to be linked together.
| Build job-ready DevOps skills in automation, CI/CD, cloud, and Kubernetes to streamline workflows and accelerate software delivery with Simpliaxis’ DevOps course |
Why Observability Matters for Modern Businesses?
For many firms, software is closely tied to income, customer service, internal processes, or brand image.
Slow apps might deter consumers. Failed transactions might affect income. A failed internal service might prevent staff from doing critical tasks. These dangers are more difficult to address manually in dispersed systems.
A cloud-native application may consist of containers, services, APIs, databases, queues, serverless workloads, and other third-party dependencies. Kubernetes says that “collecting and correlating metrics, logs, and traces may give a more complete view of the behavior of a cluster and its applications.”
Observability benefits firms in a few concrete ways:
Rapid Incident Response
When there’s a production problem, time counts. The longer a service is down or degraded, the greater the potential impact.
Observability provides engineers with additional information during an occurrence. They can utilize metrics, traces, and logs to pinpoint the issue, rather than having to search high and low.
Safer Discharges
Agile and DevOps teams make changes more regularly. Fast releases are beneficial, but every release might bring a new issue.
Observability enables teams to compare system behavior before and after deployment. If latency rises or mistakes start to surface after a change, the team has additional evidence to analyze the link.
Improved Client Experience
Users don’t care if the problem is an application service, database, container, or configuration. They simply perceive the program is sluggish or not functioning.
Observability helps technical teams understand how system behavior affects user-facing challenges.
Improved Capacity Planning
Over time, metrics may demonstrate how systems respond to increasing traffic.
Teams may utilize trends to see resource use, traffic patterns, and potential capacity issues.
Better Team Communication
Development, operations, security, and other technical teams typically have to investigate the same occurrence. A shared observability perspective might be a common source of evidence for teams.
Instead of stating “the application is slow," teams may talk about a particular service, request, trace, error, or statistic.
What Are the Best Practices for Implementing Observability in DevOps?
Observability is not a project where a team deploys a tool and calls it a day. It is an engineering technique that is iterative. Below are some of the observability practices:
Start With Essential Services
- Don't attempt to instrument everything at once.
- Start with the most important apps and services for clients or corporate activities.
- Identify the services that would be most impacted by an outage or performance problems.
- Define useful questions
Before you start collecting data, identify what it is you need to know.
For example,
- Why do requests fail?
- What are the most latency-sensitive services?
- What happens when you deploy?
- What is the frequency of failure for a certain service?
- What dependencies are impacting response time?
These questions may help determine what data needs to be gathered.
Use Consistent Naming
If one service refers to an environment as "production" while another uses "prod," it is tougher to filter. Consistent naming of services, environments, processes, and other properties facilitates the usage of telemetry.
Telemetry Correlation:
- A log may be beneficial by itself.
- A trace may be beneficial in itself.
- A metric alone may be valuable.
Connecting them, however, makes research much simpler.
For example, a trace ID might associate a request with associated logs.
Keep Alerts Focused
Too many notifications might be a problem in itself. If the engineers are alerted for every little thing, they will get desensitized.
Alerts should be directed to circumstances requiring response; a good alert must tell the person receiving it what is wrong and where to start.
Protect Confidential Data
Observability data might include information that should not be inadvertently revealed. Review logs and telemetry for sensitive information, like passwords, authentication tokens, private client information, or other personal data.
Also, it is advised that context information like baggage should be sent across services and should be accessible to downstream systems. Teams should be mindful about what they put into the context.
Control Amount of Data
More telemetry is not necessarily beneficial. Storage and processing of plenty of logs, traces, and metrics may be expensive.
Teams need to identify what information is relevant and how long it has to be kept, and what data requires great detail. Sampling traces may also be beneficial in high-volume situations.
Add Development and Deployment Data
Observability should not end at the infrastructure. DevOps teams also need to understand the link between changes to software and the system’s behavior.
Incident context may be provided via deployment events, application versions, configuration changes, and pipeline information.
- Post-incident observability assessment
- Major incidents might show gaps in visibility.
And after an occurrence, teams should ask:
- What information did we require?
- Did you find the information simple to locate?
- Was this message helpful?
- Did we have sufficient context?
- What else should we instrument for next time?
This process transforms events into improvements.
| Develop job-ready Agile skills to improve collaboration, streamline workflows, and accelerate project delivery with Simpliaxis’ Agile Certification Training. |
What are the Benefits of Observability?
Observability benefits teams in development, operations, reliability, and business.
Troubleshooting Made Faster
The most immediate effect is improved troubleshooting. By correlating data, logs, and traces, engineers can quickly narrow down issues.
Reduced MTTR
MTTR is often used to measure the time it takes to fix a service when an issue occurs. The modern DORA measurement now refers to it as “failed deployment recovery time” for recovery after a failed deployment, while larger incident procedures may still use MTTR.
Observability may lead to speedier recovery, since engineers spend less time looking for proof.
It does not guarantee a particular decrease in recovery time. The results are dependent on the quality of instrumentation, the system, the incident procedure, and the competence of the team.
More Confident While Deploying
Teams may make adjustments and carefully monitor the system.
Observability might assist in determining what has changed and where the effect was if a deployment creates a problem.
Improved System Reliability
Observability provides teams with data about system behavior so that they may do dependability work.
This may help teams see recurring failure patterns and tackle the root causes instead of continuously addressing the same symptoms.
Improved Performance
Traces might show you delayed processes. Metrics may indicate trends. Logs can tell the story.
These combined signals may assist teams in identifying performance issues that are not apparent from infrastructure data alone.
More Cooperation
Using the same evidence for multiple teams may result in more focused conversations during incident reviews.
Teams may work from the same telemetry instead of arguing over potential reasons.
Improved Knowledge of Cloud Environments
Cloud systems may be rapidly changing.
The resources may be generated, scaled, or relocated. Observability is a means to stay aware of changing surroundings.
Observability Tools That Are Popular
The decision relies on architecture, team size, budget, current technology, data volume, compliance considerations, and the sort of visibility necessary.
Some instruments are literally measurements. Others are focused on traces, logs, app performance, dashboards, or observability in general.
Open Telemetry
OpenTelemetry is not a full observability backend. It’s an open-source, vendor-neutral framework to instrument applications to produce, collect, and export telemetry data (such as traces, metrics, and logs).
It is important because teams may commonly collect telemetry without tying instrumentation to one back-end.
OpenTelemetry also includes SDKs, APIs, semantic conventions, and a collector. The collector may receive, process, and export telemetry.
Prometheus
Prometheus is an open-source monitoring and alerting toolset focusing on metrics and time series data. It gathers and saves metrics and offers a query language to interact with that data.
It’s a popular choice for teams that want powerful statistics gathering, querying, dashboards, and alerting.
Prometheus doesn’t provide the full observability experience for every use case. It is possible to integrate it with additional components for logs, traces, visualization, and long-term data requirements.
Grafana
Grafana is a visualization and observability platform for metrics, logs, traces, and other telemetry. It speaks about the advantages of connecting metrics, logs, traces, and profiles, which is called “observability signals” in its documentation.
It may be used to create dashboards and analyze telemetry from several sources.
Jaeger
Jaeger is an open-source distributed tracing system. It helps teams trace and debug distributed processes, identify performance bottlenecks, analyze service dependencies, and investigate root causes.
Distributed tracing is a significant need that is especially important.
Motadata
ObserveOps by Motadata provides observability for DevOps environments.
Its product notes say ObserveOps gathers signals, including logs, metrics, traces, events, infrastructure telemetry, builds, deployments, and pipelines. It also looks at correlation across apps, infrastructure, CI/CD, and Kubernetes.
For companies that want a more consolidated view of DevOps operations, this type of solution may reduce the need to switch between different sources while troubleshooting.
The main thing is that the decision to use observability tools should be based on what the company requires, not on what is a popular product.
| Master cloud computing essentials to design, deploy & scale applications. Gain global skills with Simpliaxis Cloud Computing course |
Challenges of Observability & How to Overcome Them?
Observability can address visibility issues, but it has its implementation concerns.
Too Much Data
A typical error is to gather everything but not decide what is valuable. Logs, traces, and metrics may expand extremely fast. The answer is to set priorities.
Begin with critical services and helpful prompts. Establish retention standards and examine whether data is really being used in investigations.
High Costs
Telemetry storage & processing may be costly, particularly in high-volume systems. Teams may mitigate these issues by managing data volume, employing proper retention periods, sampling traces when applicable, and eliminating unwanted telemetry.
Design in cost; don't wait until observability is costly to run.
Alert Fatigue
If each abnormal occurrence triggers an alert, engineers could be bombarded with alarms. The solution isn’t necessarily additional rules. Alerts need to be related to real service conditions and actions.
Inconsistent Data
Different services may have different field names and formats. Such variation makes it tougher to correlate. Being consistent with name and semantic norms may assist. OpenTelemetry offers semantic norms for logs, metrics, traces, resources, and other telemetry data.
Complex Environments
Instrumenting a system with several services, containers, databases, and cloud resources may be challenging. Staged deployment may make the process simpler. Start with a single core service, set the benchmarks, verify the information, and then expand.
Lack of Skills
Observability is not a mere tooling concern. Teams require individuals who know telemetry, distributed systems, alert design, incident response, and performance analysis. With training and documentation, engineers can make effective use of the data supplied.
Security and Privacy Concerns
The telemetry may include important information. Teams want clear rules about what they can track, who can access it, where it is stored, and how long it is kept.
Poor Correlation
Collecting metrics, logs, and traces in different systems without a consistent context may make inquiry difficult. Common service names, trace IDs, timestamps, resource information, and other common properties might assist correlation.
Learn MoreHow Do You Make a System Observable?
Instrumentation is the key to providing observability in a system. It is said that a system must be instrumented to output signals from its code, such as traces, metrics, and logs. These signals are then forwarded to an observability backend for analysis.
A possible practical procedure may look like this:
1. System Mapping
First, get to know the architecture. List all relevant application(s), service(s), database(s), queue(s), API(s), cloud resource(s), and external dependencies. If you don’t comprehend something, you can’t see it.
2. Find Crucial Pathways
Identify the most important requests and processes. For example, an online firm may be more concerned with login, search, checkout, payment, and order processing. These pathways should have good observability coverage.
3. Add Metrics
Start by monitoring some simple service metrics like traffic, latency, faults, and saturation. These give a handy, high-level picture of how healthy the service is.
4. Add Structured Logging
Search & normalize logs. Provide helpful background, but avoid sharing sensitive info. Add identifiers that may be used to correlate logs and traces, where feasible.
5. Add Distributed Tracing
Tracing is especially helpful when a request travels via many services. Include critical service-to-service calls, database operations & other critical dependencies.
6. Use Common Context
Use consistent naming and IDs across telemetry. OpenTelemetry’s semantic rules allow teams to utilize common names and properties across services and languages.
7. Effective Dashboards
Dashboards are not for displaying data. For a crucial service, a dashboard may provide request rate, latency, faults, saturation, ongoing deployments, and essential dependency information. Don’t put all the metrics you have on the dashboard.
8. Generate Actionable Notifications
An alarm should be a state that has to be addressed. Give enough information so the person replying knows what service is impacted and where to start.
9. Check the Observability System
Don’t wait until there is a production issue to discover telemetry is missing. Test for typical failure situations. "Would the data available help an engineer to find the cause?"
10. Keep Becoming Better
Observability should increase with the system. New services are created, new failure patterns show up, architecture changes, and the observability methodology needs to evolve too.
| Gain job‑ready Kubernetes skills to automate container orchestration, improve collaboration & accelerate deployments with Simpliaxis Kubernetes course. |
What DevOps Leaders Should Also Understand About Observability?
DevOps executives must grasp that observability is not merely a tool purchase. A platform may gather millions of telemetry recordings, but it does not guarantee the organization has strong observability. The primary purpose is to help the team better grasp the program and work with it.
Business Objectives Should Be Enabled By Observability
Teams need to link technical indications to meaningful results. For instance, a high error rate for an internal service that is never used may not be as important as a minor rise in unsuccessful checkout requests. But it doesn’t imply technical measurements are not significant. It implies teams need to understand what services and signals matter most to the company.
Observability Should Enable Agile Delivery
Agile teams operate in short cycles and react to input. Observability gives feedback from the system under operation. After the release, teams may utilize telemetry to find out whether the modification acted as planned. This produces a nice feedback loop:
Build-Test-Release-Monitor-Iterate
That cycle is part of the larger DevOps aim of providing changes while also ensuring system dependability.
Leaders Need to Measure Results
DORA presently tracks five indicators of software delivery performance in the areas of delivery throughput and stability, including deployment frequency, failed deployment recovery time, change failure rate, and deployment rework rate.
Observability in and of itself does not drive DORA performance. Instead, it may provide insight that helps teams understand and improve the drivers of those results.
Prevent Tool Sprawl
When a team has a visibility challenge, throwing another tool into the mix may make managing the environment much more difficult. Before introducing another system, leaders should inquire whether they can link to current telemetry.
Build Observability Into Engineering Norms
We need to set expectations around logging, analytics, tracing, naming, security, retention, and warnings. It brings observability into the regular flow of development, not something you tack on when you have a problem.
Engineering Data as Telemetry
Telemetry must be treated as engineering data of importance, developed, assessed, safeguarded, and kept as such. It has to be owned. And someone should decide what is gathered, where it goes, who can access it, and how it is used.
Most Common Observability Use Cases
Observability use cases can be categorized in many areas of software development and operations.
Troubleshooting Production
Troubleshooting production issues is one of the most common uses of observability. Telemetry helps engineers identify which service was affected and investigate the root cause when an application experiences downtime or performance degradation.
Distributed Application Tracing
You may use tracing to see the route a request takes via numerous services. This is helpful to catch sluggish or failed dependencies.
Performance of Application Monitoring
Metrics and traces help teams find delayed requests, costly activities, and performance changes.
Infrastructure Wellness
Metrics may assist teams monitor cpu, memory, disk, network, container, and other infrastructure characteristics.
Kubernetes Monitoring
Kubernetes setups generate a lot of telemetry. Observability aids teams in understanding cluster components, workloads, and applications via the collection and correlation of metrics, logs, and traces.
Monitoring Deployments
Teams may associate deployment events with changes in system behavior. A spike in mistakes quickly after a release is a major point of study for a deployment.
Visibility Into CI/CD
Build failures, test results, deployment events, pipeline length, and release results are available to DevOps teams. This helps to relate software delivery activities to production behavior.
Capacity Planning
Long-term statistics reveal trends in resource use and traffic. Teams may utilize this data to design capacity proactively before resources become a severe constraint.
Incident Investigation
When anything goes wrong, telemetry tells the story of what happened. Traces can reveal request pathways, metrics can indicate trends, and logs can tell specific occurrences.
Root Cause Analysis (RCA)
Observability may help in root cause analysis by linking numerous signals. It doesn’t always reveal the underlying problem, but it can reduce the manual research needed to find it.
Testing Performance
Telemetry may provide an understanding of how an application performs under various loads. Teams may compare latency, faults, resource use, and throughput.
User Experience Monitoring
Technical health does not necessarily correlate with user experience. If a system is using a typical amount of CPU, consumers can still encounter sluggish pages. Observability helps teams relate application activity to user-facing performance.
Security Investigation
Logs and other telemetry can provide useful records during security investigations. Security observability, however, calls for rigorous management of access and data processing since telemetry might include sensitive information.
Conclusion
As applications get more dispersed, releases become quicker, and cloud environments become more complicated, observability has become a key feature of contemporary DevOps. Observability is fundamentally about knowing what's occurring within a system by looking at the data the system emits. When teams correctly gather, order, and connect these signals, they have a far stronger foundation for diagnosing and responding to incidents. And for Agile teams, observability also offers an effective feedback loop between dev and production. A team may deploy a change, see how the system responds, find unforeseen consequences, and utilize that knowledge to better the next iteration.
For cloud teams, observability enables insight into services, containers, infrastructure, and dependencies that may be difficult to grasp as a single system. The trick is not to acquire as much data as you can. Good observability begins with relevant inquiries and vital services. It employs consistent telemetry and secures sensitive information. It offers engineers actionable information. It’s also vital to understand that observability is not just about purchasing a tool. Tools provide you with the technology, but teams need clear standards, effective instrumentation, relevant alerts, incident protocols, and people who can read the data.
As these parts start to come together, observability may help DevOps teams release with more confidence, analyze events with less guessing, and design more dependable software systems.






 Lowest-Price Challenge











 Personalized Path


.webp)


 USA
USA  Canada
  India
India  UK
UK  Australia
  Singapore


