


 Call Us




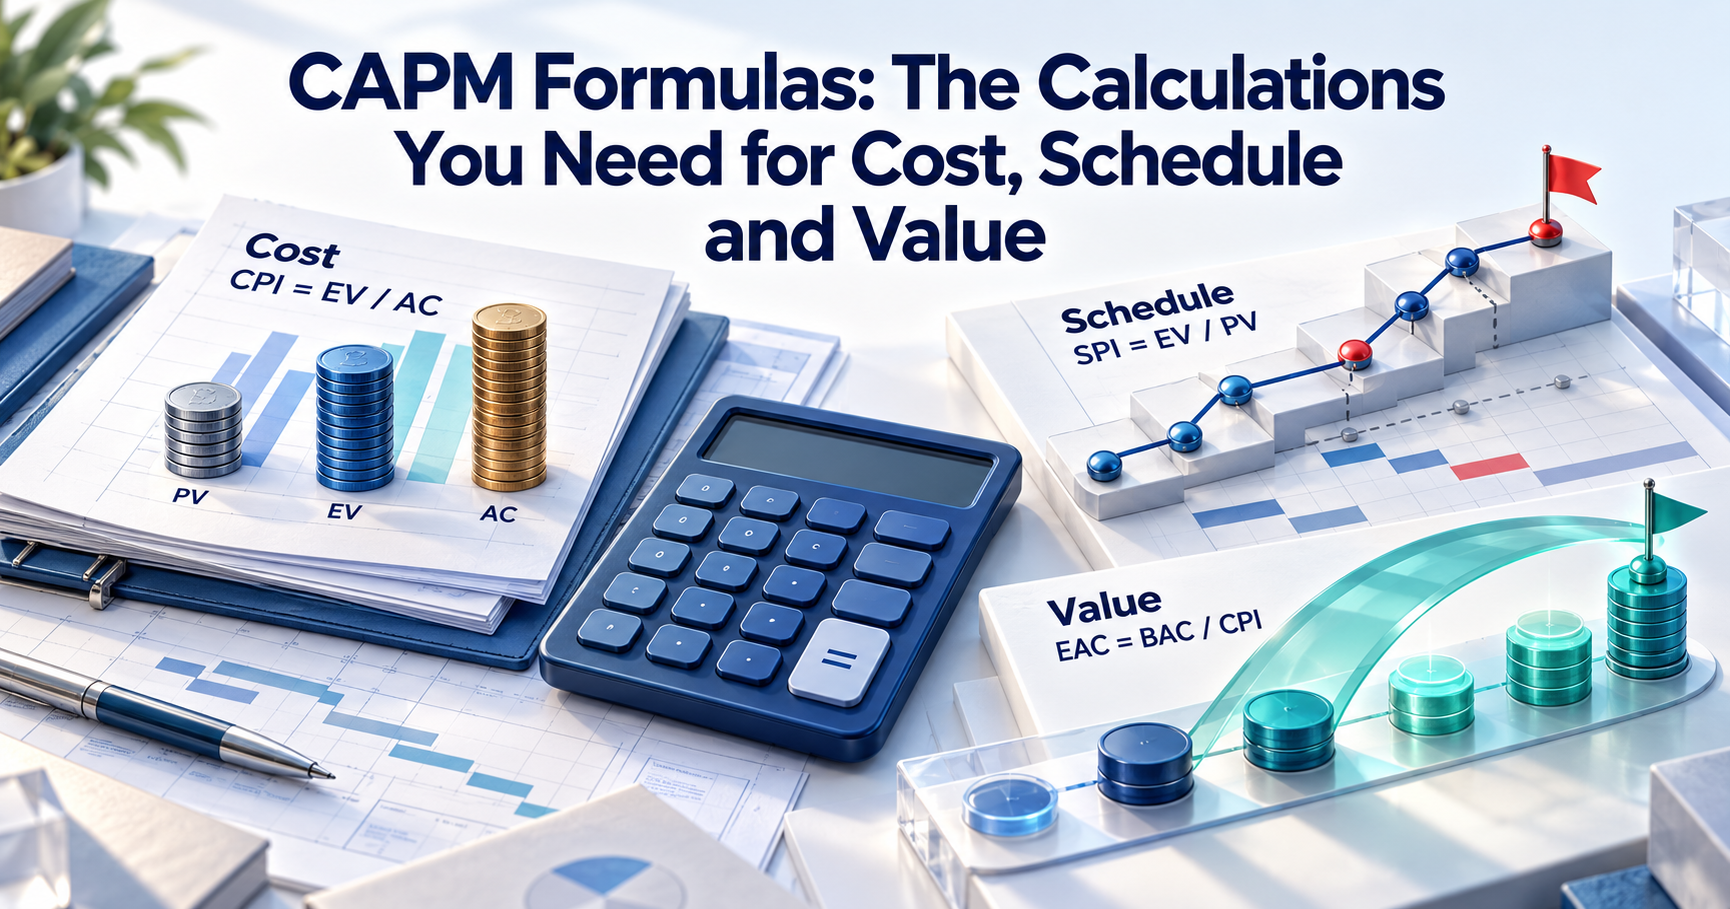
Drive Link: CAPM formulas_ Cost, schedule & value.png
CAPM Formulas: The Calculations You Need for Cost, Schedule and Value
CAPM formulas are the calculations PMI expects entry-level candidates to understand for tracking cost, schedule and value on a project. The core set covers earned value (PV, EV, AC, CV, SV, CPI and SPI), forecasting (EAC, ETC, VAC and TCPI), scheduling (critical path, float and three-point estimates) and communication channels, n(n − 1) / 2. The maths is simple. What the exam really tests is whether you can read the result: a CPI or SPI below 1.0 means the project is over budget or behind schedule, and a value above 1.0 means it is doing better than planned.
Key Highlights of CAPM Formulas
- The CAPM exam has 150 questions in 180 minutes, spread across four domains in PMI's current exam content outline. Most calculation questions come from the predictive, plan-based domain.
- Earned value formulas compare planned work, completed work and actual cost to show how a project is really doing.
- Forecasting formulas (EAC, ETC, VAC and TCPI) tell you where the budget is likely to end up.
- Schedule formulas cover the critical path, total float, free float and three-point estimates.
- Communication channels, expected monetary value, velocity and simple value measures round out the list.
- Reading the result matters as much as calculating it. Many questions ask what a number means, not just what it is.
- A one-page CAPM formulas cheat sheet and regular timed practice are the quickest way to make these stick.
Introduction
For many people preparing for the Certified Associate in Project Management (CAPM) exam, the formulas feel like the scariest part. You see a page full of letters like EV, AC, ETC and TCPI, and it starts to look like an accounting test. The good news is that it is not.
CAPM formulas use basic arithmetic: adding, subtracting, multiplying and dividing. Once you understand the story behind each one, the numbers start to make sense on their own. Earned value tells you whether you are getting the work done for the money you planned to spend. Schedule formulas show which tasks can slip and which cannot. Estimating formulas turn uncertainty into a usable number.
PMI does not publish an official formula list for the CAPM exam. The calculations come from the cost, schedule, risk and communication concepts described in PMI's standards and guides, which the exam content outline draws on. This guide pulls together the project management formulas that entry-level candidates are expected to know.
For each one, you will find the expression, what it is used for, a worked example and a simple way to remember it. You will also get a CAPM formulas cheat sheet, practice scenarios, memory tips and the mistakes that cost candidates marks most often.
Which Formulas Appear on the CAPM Exam?
See how these domains break down topic by topic in the CAPM certification syllabus.
The CAPM exam follows PMI's exam content outline, which took effect in July 2023. It has 150 multiple-choice questions to finish in three hours, split across four domains:
| Domain | Share of the exam |
| Project Management Fundamentals and Core Concepts | 36% |
| Predictive, Plan-Based Methodologies | 17% |
| Agile Frameworks/Methodologies | 20% |
| Business Analysis Frameworks | 27% |
Most calculation questions sit in the predictive domain, because that is where cost and schedule control live. Communication channels can show up under the fundamentals domain, velocity under agile, and benefit measures under business analysis.
Since PMI does not name specific formulas, it helps to group them by purpose:
- Earned value formulas to measure cost and schedule performance today
- Forecasting formulas to predict the final cost of the project
- Schedule formulas to find the critical path, float and estimated durations
- Communication and other formulas for channels, risk value, agile progress and benefits
Expect only a modest number of pure number-crunching questions. A larger share will give you a result, such as "the CPI is 0.85", and ask what it means or what the project manager should do next. So learn the formulas, but learn the interpretation even more.
Earned Value Formulas
Earned value management (EVM) is the backbone of CAPM formulas for cost and schedule. It combines scope, time and cost into one view, so you can see whether the work completed is worth what you have spent.Plotted over time, PV, EV and AC form the classic S-curve in project management, which makes the gap between plan and reality visible. Everything in this section starts from three basic values.
PV, EV and AC
Planned Value (PV): the approved budget for the work scheduled to be done by a given date. It answers, "How much work did we plan to finish by now?"
Earned Value (EV): the budgeted value of the work actually completed. It answers, "How much work did we really finish, in budget terms?"
- Formula: EV = % of work complete × BAC
- BAC (Budget at Completion) is the total approved budget for the project.
Actual Cost (AC): the money actually spent on the work completed so far. It answers, "What did that work cost us?"
Example: A website redesign has a BAC of $50,000. By week 6, the plan said 50% should be done, so PV = $25,000. Only 40% is complete, so EV = 0.40 × $50,000 = $20,000. The team has spent $24,000, so AC = $24,000.
Memory tip: Think "Plan, Earn, Actual" in that order. PV is the plan, EV is the work you earned, and AC is the bill you paid.
CV, SV, CPI and SPI
These four formulas compare EV with AC (cost) and with PV (schedule). EV always comes first.
Cost Variance (CV) = EV − AC

Schedule Variance (SV) = EV − PV

Cost Performance Index (CPI) = EV / AC
Shows how much value you get for every dollar spent. Here, CPI = 20,000 / 24,000 = 0.83, so you earn about 83 cents of work for each dollar.
Schedule Performance Index (SPI) = EV / PV
Shows how fast work is moving compared with the plan. Here, SPI = 20,000 / 25,000 = 0.80, so the team is working at 80% of the planned pace.
How to read the results:
- Variance below 0 or index below 1.0: bad (over budget or behind schedule)
- Variance of 0 or index of 1.0: exactly on plan
- Variance above 0 or index above 1.0: good (under budget or ahead of schedule)
For a deeper look at how teams use these numbers in real projects, read our guide to CPI and SPI metrics.
Memory tip: "C goes with A, S goes with P." Cost compares against Actual cost, Schedule compares against Planned value. And EV always leads: subtract from it for variances, divide by it on top for indices.
Forecasting Formulas
Earned value tells you where the project stands today. Forecasting formulas take that information and project it forward, so you can warn stakeholders early if the budget is heading for trouble. We will keep using the website redesign example: BAC = $50,000, PV = $25,000, EV = $20,000, AC = $24,000, CPI = 0.83 and SPI = 0.80.
EAC
Estimate at Completion (EAC) is the expected total cost of the project when all the work is done. There are four common versions, and the question wording tells you which one to pick.

Memory tip: Listen for the clue words. "Current trends will continue" or "typical" means BAC / CPI. "Atypical", "one-time" or "will not happen again" means AC + (BAC − EV). "Original estimate was flawed" means bottom-up ETC.
ETC and VAC
Estimate to Complete (ETC) = EAC − AC
ETC is how much more money you need to finish the project from today. Using the typical EAC: $60,000 − $24,000 = $36,000 still to spend.
Variance at Completion (VAC) = BAC − EAC

Memory tip: ETC is the "rest of the trip": total trip (EAC) minus the distance already covered (AC). For VAC, think "budget minus forecast", the same direction as CV, so negative is still bad.
TCPI
To-Complete Performance Index (TCPI) tells you how efficiently the team must use its remaining money to hit a target.
- To finish within the original budget: TCPI = (BAC − EV) / (BAC − AC)
- To finish within a new, approved EAC: TCPI = (BAC − EV) / (EAC − AC)

Unlike CPI, a TCPI above 1.0 is bad news, because it means the work ahead must be done more efficiently than planned. Below 1.0 means you have some room to spare.
Memory tip: TCPI is "work left divided by money left". The top is the work still to do (BAC − EV), and the bottom is the money still available (BAC − AC or EAC − AC).
Schedule Formulas
Schedule questions on the CAPM exam usually involve a small network of activities, or an estimate built from a range of possible durations. The arithmetic is light, but you need to work carefully and in the right order.
Critical Path and Float
The critical path is the longest path of dependent activities through the network. It sets the shortest possible time to finish the project. Any delay to an activity on the critical path delays the whole project.
To find it, you do a forward pass and a backward pass:
- Forward pass (start to finish): Early Finish (EF) = Early Start (ES) + Duration. A successor's ES is the largest EF among its predecessors.
- Backward pass (finish to start): Late Start (LS) = Late Finish (LF) − Duration. A predecessor's LF is the smallest LS among its successors.
This guide uses the "start at day 0" convention. Some textbooks start at day 1 and add or subtract 1 at each step. Both give the same critical path and float, so pick one method and stick with it.
Total Float = LS − ES (or LF − EF)
Total float is how long an activity can be delayed without delaying the project end date. Activities on the critical path normally have zero total float. If an activity has ES = 4 and LS = 7, it has 3 days of total float.
Free Float = ES of the next activity − EF of the current activity
Free float is how long an activity can be delayed without delaying the early start of the activity that follows it. It is always equal to or less than total float.
If you want to practise drawing networks step by step, our guide to project scheduling techniques walks through the critical path method alongside other approaches.
Memory tip: "Late minus Early equals float." Starts with starts, finishes with finishes. And remember that the critical path is the longest path, not the shortest.
Three-Point Estimates
Three-point estimating reduces guesswork by using three values for each activity:
- O = Optimistic (best case)
- M = Most likely
- P = Pessimistic (worst case)
Triangular distribution: E = (O + M + P) / 3
A simple average that gives all three values equal weight.
Beta distribution (PERT): E = (O + 4M + P) / 6
Gives the most likely value four times the weight of the others, so the estimate leans towards what usually happens.
Standard deviation (PERT): SD = (P − O) / 6
Shows how uncertain the estimate is. A wider gap between pessimistic and optimistic means more risk.
Example: A testing activity has O = 4 days, M = 6 days and P = 14 days.
- Triangular: (4 + 6 + 14) / 3 = 8 days
- PERT: (4 + 24 + 14) / 6 = 7 days
- SD: (14 − 4) / 6 = 1.67 days
Notice how PERT pulls the estimate closer to the most likely value. Read more about how this works in our article on PERT estimating.
Memory tip: For PERT, think "1-4-1 over 6": one O, four Ms, one P, divided by six. If the question says "beta" or "PERT", use 6. If it says "triangular" or "simple average", use 3.
Communication and Other Formulas
A few project management formulas fall outside cost and schedule but still turn up in CAPM practice questions.
Communication channels = n(n − 1) / 2, where n is the number of people, including the project manager. It shows how quickly communication gets complicated as a team grows. A team of 6 has 6 × 5 / 2 = 15 channels. Memory tip: "multiply by one less, then halve it". If the question asks how many channels were added, work out both totals and subtract.

Velocity and sprints remaining. In agile teams, velocity is the number of story points completed per sprint. Sprints remaining = remaining story points / average velocity, rounded up.
Simple value measures. Return on Investment (ROI) = (Benefit − Cost) / Cost × 100. ROI, BCR and payback period are also core project selection methods.Benefit-Cost Ratio (BCR) = Benefits / Costs, where a value above 1.0 means benefits outweigh costs. Payback period = initial investment / yearly cash inflow.
CAPM Formulas Cheat Sheet
Keep this CAPM formulas cheat sheet close for quick revision. It covers four of the formulas candidates mix up most often.
| Formula | Expression | When to Use | Memory Aid |
| CPI | EV / AC | To check cost efficiency: how much value each dollar spent is producing | "C goes with A." Below 1.0 = over budget |
| SPI | EV / PV | To check schedule efficiency: how fast work is progressing against the plan | "S goes with P." Below 1.0 = behind schedule |
| EAC | BAC / CPI (typical); AC + (BAC − EV) (atypical); AC + bottom-up ETC; AC + [(BAC − EV) / (CPI × SPI)] | To forecast the total cost at completion based on performance so far | Match the clue word: "typical", "one-off", "re-estimate" or "fixed deadline" |
| Channels | n(n − 1) / 2 | To work out how many communication paths exist in a team | "Multiply by one less, then halve it" |
Worked Examples for Each Group
Try each one yourself before reading the answer.
Group 1: Earned value and forecasting
A training portal project has a BAC of $100,000. At the end of month 4, the plan called for 40% completion, but only 35% is done. The team has spent $42,000.
- PV = 0.40 × $100,000 = $40,000; EV = 0.35 × $100,000 = $35,000; AC = $42,000
- CV = 35,000 − 42,000 = −$7,000 (over budget)
- SV = 35,000 − 40,000 = −$5,000 (behind schedule)
- CPI = 35,000 / 42,000 = 0.83; SPI = 35,000 / 40,000 = 0.875
- EAC = 100,000 / 0.833 = $120,000; ETC = 120,000 − 42,000 = $78,000
- VAC = 100,000 − 120,000 = −$20,000
- TCPI = (100,000 − 35,000) / (100,000 − 42,000) = 1.12
The project is over budget and behind schedule, and the team would need to work far more efficiently to stay within $100,000.
Group 2: Schedule
Activity A (3 days) starts the project. B (4 days) and C (6 days) both follow A. D (2 days) follows both B and C.
- Path A-B-D = 3 + 4 + 2 = 9 days
- Path A-C-D = 3 + 6 + 2 = 11 days, so A-C-D is the critical path and the project takes 11 days
- Forward pass for B: ES = 3, EF = 7. Backward pass for B: LF = 9, LS = 5
- Total float of B = LS − ES = 5 − 3 = 2 days. Free float of B = ES of D (9) − EF of B (7) = 2 days
Group 3: Communication and other
A team grows from 8 to 10 people. Channels go from 8 × 7 / 2 = 28 to 10 × 9 / 2 = 45, so 17 channels are added. Separately, an agile team with 120 story points left and an average velocity of 24 needs 120 / 24 = 5 more sprints.
Tips to Remember Formulas
- Learn the three building blocks first. Most cost-related project management formulas are built from PV, EV, AC and BAC. Once those are clear, the rest follow.
- Use one running example. Work every formula on the same small project so you can see how each result connects to the others.
- Write a brain dump. Practise writing all your formulas from memory in under five minutes. Check with the testing provider whether scratch space is allowed before or during your exam.
- Say the meaning out loud. For every answer, add a sentence such as "CPI of 0.9 means we get 90 cents of value per dollar."
- Practise under time pressure. Aim to solve a typical calculation question in about a minute. and test yourself with a CAPM practice test.
For a wider study plan beyond formulas, see these CAPM exam preparation tips.
Common Calculation Mistakes
- Reversing the order. CV is EV − AC, not AC − EV. Flip it and a cost overrun suddenly looks like a saving.
- Mixing up PV and AC. Schedule formulas use PV; cost formulas use AC.
- Reading TCPI like CPI. For CPI, above 1.0 is good. For TCPI, above 1.0 means the remaining work is harder.
- Picking the wrong EAC. Read the scenario for clue words before you choose a formula.
- Forgetting the project manager in channels. Count everyone, including yourself.
- Calling the shortest path critical. The critical path is always the longest path through the network.
- Rounding too early. Keep full figures until the final step, then round to match the answer options.
Conclusion
CAPM formulas look intimidating at first, but they rest on a handful of simple ideas: what you planned, what you earned, what you spent and how long the work should take. Learn PV, EV and AC well, understand what each index tells you, and practise until choosing the right EAC or reading a TCPI feels natural.
If you want structured guidance, Simpliaxis CAPM certification training covers every formula group with trainer-led examples, practice questions and full mock exams, so you can walk into the test confident with the numbers.







 Lowest-Price Challenge












 Personalized Path



.webp)


 USA
 Canada
 India
 UK
 Australia
 Singapore


