


 Call Us



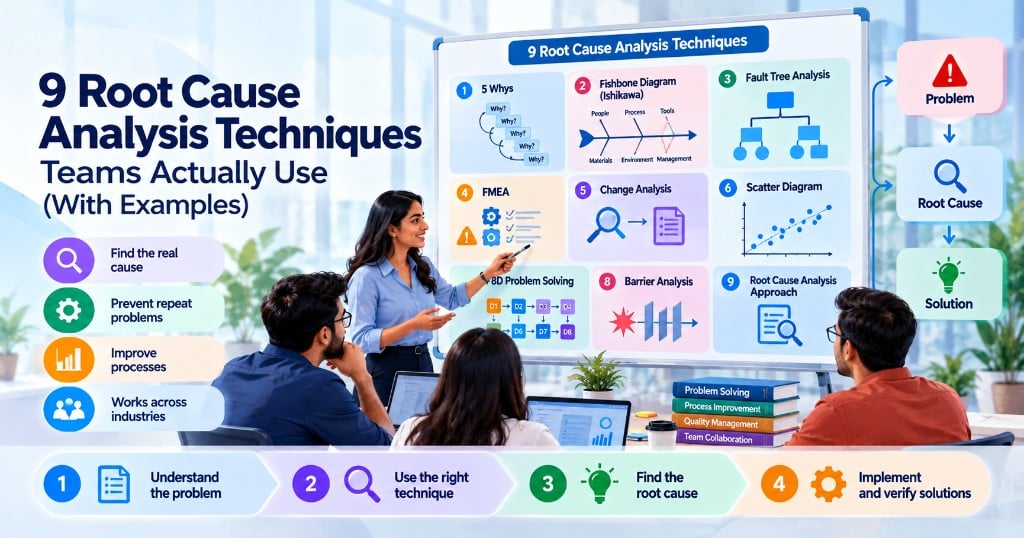
Techniques such as root cause analysis enable teams to understand why a problem occurred rather than just treating its visible symptoms. By determining the real cause of a problem, organizations can stop the same failure from occurring again and can also improve processes and decision-making.
Some of the most used root cause analysis techniques are: 5 Whys, Fishbone (Ishikawa) Diagram, Fault Tree Analysis, Failure Mode and Effects Analysis (FMEA), Change Analysis, Scatter Diagram, 8D Problem Solving, and Barrier Analysis.
It is contingent upon the problem, which determines the right way to do it. Teams often use 5 Whys for simple problems. For complex issues involving multiple possible causes, tools like a fishbone diagram, root cause analysis approach, or FMEA provide deeper investigation.
Key Highlights of Root Cause Analysis Techniques
- Root cause analysis focuses on removing the source of a problem rather than treating symptoms.
- The 5 Whys root cause analysis method works well for straightforward problems where causes can be traced step-by-step.
- A fishbone diagram helps teams explore multiple categories of possible causes.
- FMEA is useful for identifying and preventing failures before they occur.
- RCA is commonly used in Six Sigma, IT service management, software testing, manufacturing, healthcare, and Agile teams.
- Combining multiple root cause analysis techniques often produces more reliable solutions.
- Corrective actions should always be verified to ensure the problem does not return.
What Root Cause Analysis Is and Why Quick Fixes Fail
All organizations have issues.
A software application crashes due to an update. A manufacturing line produces defective items. A customer keeps receiving the wrong order. The website keeps crashing.
The initial reaction is often to fix what can be seen:
- Reboot the server.
- Replace the broken part.
- Give the customer a refund.
- Correct the software bug.
These steps may temporarily get things working again, but they do not always fix the underlying problem.
And this is where root cause analysis (RCA) comes in.
Root cause analysis is a systematic approach for finding the root of a problem. Not asking at all:
Now what do we do to fix this problem?
RCA asks:
“What caused this problem, and how can we ensure it doesn’t happen again?”
A good RCA investigation should go beyond the immediate failures and look at the processes, systems, human factors, technology, and environmental conditions.
As an example:
A company finds that customers are getting their deliveries late.
One quick fix would be to employ more delivery staff.
But a root cause analysis might show that:
- Mistakes are made when orders are entered manually.
- Inventory data are old.
- Delivery routes are not being optimized.
- Approval processes cause unnecessary delays.
Perhaps the real solution is not to add people but to improve the workflow.
Symptoms vs. Causes vs. Root Causes
Before you apply any root cause analysis technique, it is important to know the difference between symptoms, causes, and root causes.
- Level
- Signification
- instance
Symptom:
- The perceived problem or effect
- The website is offline
- Causality
- One factor contributing to the problem
- Server resources are not enough
Primary Cause:
The reason that permitted the cause to happen.
No capacity planning process for traffic growth
Many teams stop at the cause because it seems to solve the immediate problem. But if you don’t fix the root cause, the same thing may fail again.
For example:
Problem: Users are unable to log into an internal application.
Symptom: Failed logins
Cause: Authentication server is busy.
Root Cause : Lack of a monitoring system to catch demand increases on servers.
The corrective action must be to address the missing monitoring and capacity planning process, not just restart the server.
Where Root Cause Analysis Fits?
Root cause analysis is one component of a larger problem-solving process that is used in many different industries.
In Six Sigma, RCA sits in the Analyze phase of the DMAIC methodology (Define, Measure, Analyze, Improve, Control).
Used often in:
- Six Sigma process improvements
- Software Development & Testing
- Service management IT
- Quality control in manufacturing
- Healthcare improvement programs
- Business activities
- Product management
- Enhanced customer experience
RCA is frequently used after the fact, but it can be proactive as well.
For example:
A manufacturing company might use FMEA before launching a new product to identify possible failures before customers do.
A software team might review old bugs to improve development practices.
Incidents can be reviewed by a healthcare organization to improve patient safety procedures.
Teams that want a structured, hands-on way to apply these methods can start with root cause analysis training that covers 5 Whys, Fishbone and FMEA with real cases.
Which Root Cause Analysis Technique Should You Use?
There is no single root cause analysis method that is best for all situations. The correct technique depends on:
- Complexity of the problem
- Data available
- Level of risk
- Quantity of possible causes
- Industry needs
- Time to investigate
9 Root Cause Analysis Techniques Explained With Examples
1. 5 Whys
The 5 Whys is one of the simplest and most popular root cause analysis techniques.
It keeps asking “Why?” until the team digs down to the root cause of a problem.
It was developed as part of the Toyota Production System and is a common technique in Lean and continuous improvement practices.
How the 5 Whys Work
It begins with a problem statement.
Example:
Problem: The company website went down during the product launch.
Why 1. Why did the website go offline?
Because the server couldn't handle the added traffic.
Why 2: Why could the server not handle the traffic?
They did not pre-scale server capacity before launch.
Why 3: Why did the capacity not increase?
As there were no traffic estimates in the launch planning.
Why 4: No traffic estimates available.
Marketing and technical teams did not share launch forecasts.
Why 5: Why didn’t they share forecasts?
Because there was no communication process set between departments.
Root Cause:
There was no formal launch planning process in the organization.
It’s not just about upgrading servers. The company needs to have better planning and communication workflows.
When to Use the 5 Whys
5 Whys is best when:
- The problem has a definite sequence of events.
- The problem isn’t that complicated.
- Teams need an easy way to investigate.
- The cause is probably related to process gaps.
Drawbacks of 5 Whys
The 5 Whys can be useful, but it’s not perfect.
It might oversimplify complex problems, as some failures have multiple root causes. In these cases, combining it with a fishbone diagram or another RCA tool yields better results.
The 5 Whys came out of Toyota’s production system and is still one of the simplest Lean Six Sigma tools for moving from a symptom to a process cause.
2. Fishbone (Ishikawa) Diagram
A fishbone diagram (also known as an Ishikawa diagram or cause-and-effect diagram) is a graphical representation used to identify many possible causes of a problem.
a method popularised by Kaoru Ishikawa and documented by the American Society for Quality.
The diagram is reminiscent of a fish skeleton:
- The problem is revealed at the head.
- Bones split off the possible causes.
This is useful for teams to organise brainstorming sessions.
A common fishbone diagram includes categories such as:
- Human
- Method
- Equipment
- Ingredients
- Measurement
- Environment
These categories are sometimes known as the 6M framework.
The fishbone diagram is one of the core Six Sigma Green Belt tools because it forces a team to look at every category of cause (Man, Machine, Method, Material, Measurement, Mother Nature) before agreeing on one
Fishbone Diagram Root Cause Analysis Example
Problem:
A manufacturing company is experiencing an increase in product defects.
The team develops a fishbone diagram and identifies possible causes:
People
- New employees do not get trained.
- Instructions are not clear.
Process
- Quality checks are too late.
- Production steps are not consistent.
Equipments
- All machines require service.
- Sensors are faulty.
Materials
- Supplier quality varies with materials.
- Received wrong materials.
Measurement
- Old ways of inspecting.
Environment
- Temperature influences the quality of production.
After testing, the team discovers that the main problem is an ageing machine calibration.
Advantages of Fishbone Diagrams
- A fishbone diagram helps teams to:
- Look at it from different angles.
- Don’t jump to conclusions.
- Uncover hidden contributors.
- Facilitate structured discussions.
It is useful especially when the problem has no obvious reason.
3. Fault Tree Analysis (FTA)
Fault Tree Analysis (FTA) is a top-down technique for RCA and is commonly used in safety-critical industries such as aviation, engineering, and software reliability.
Don’t ask. "Why would this be?"
FTA questions:
What combinations of failures might have resulted in this event?
It starts with a big unwanted event and works backward.
Example:
Top Event: Aircraft system malfunction
Reasons might be:
- Electrical breakdown
- Software failure
- Hardware Dismantling
Each cause is broken down further until basic failures are identified.
FTA uses logical connections like:
- AND clauses
- OR Conditions
For example:
A system failure can only happen when a software error and a backup system failure happen at the same time.
The Fault Tree Analysis is useful for failures involving many linked systems and risks.
4. Failure Mode and Effects Analysis (FMEA)
Unlike reactive methods, Failure Mode and Effects Analysis (FMEA) scores each failure mode on Severity, Occurrence and Detection to get a Risk Priority Number (RPN) before anything breaks.
FMEA is a proactive root cause analysis method that is utilised to identify potential failures before they occur.
Many RCA techniques are about investigating problems after the fact, whereas FMEA is about prevention.
Teams analyse:
- What’s the downside?
- How can it fail?
- How much damage will the failure cause?
- How can you reduce your risk?
FMEA is often used in:
- Manufacture
- Automobile Industries
- Health
- Software development
- Product design
- Engineering
How FMEA Function?
Teams look at three big factors for each potential failure:
1. Degree of severity
If it fails, what would be the scale of the impact?
Sample:
A high severity would be a payment system failure that impacts all customers’ ability to make a purchase.
2. Distribution
How probable is the failure to occur?
Example:
A database problem that happens so rarely it is rare may be less common than a daily checkout problem.
3. Uncovering
How likely is the failure to go undetected until damage has occurred?
Example:
Automation monitoring systems can help to identify problems early and reduce risk.
These factors are often combined into a Risk Priority Number (RPN) to assist teams in deciding which failures they need to tackle first.
A full FMEA worksheet and scoring scales are explained in ASQ’s FMEA guide.
FMEA Example
One software company is releasing a mobile banking app.
Potential failure mode:
Failure: Users can’t make money transfers.
Possible causes:
- API connection error
- Wrong rules for validation
- Server crashes
Effects:
- Transactions that failed
- Customer complaints
- Trust loss
Preventive measures:
- Add automated tests.
- API Monitoring Improvement.
- Perform load testing before going live.
FMEA encourages teams to transition from reactive troubleshooting to proactive risk management.
5. Change Analysis
Change Analysis is a root cause analysis technique used when a problem occurs following a change or update.
It is about finding out what changed before the problem happened.
This approach is especially helpful in the following areas:
- Operations, IT
- Software test
- Manufacturing Processes
- Business Processes
The study compares:
- What worked before this?
- What was different?
- When did this problem start?
- How could the change have produced the failure?
Change Analysis Example
A company’s application starts throwing login errors after a new release.
The team looks into:
Before the change:
- The login system worked well.
- The authentication service was stable.
Post-Change:
- Database configuration changed.
- Updated security rules.
An investigation revealed that a configuration change was blocking authentication requests.
Root Cause:
Deployment with incorrect settings.
Corrective Action:
Create a deployment checklist and require that configuration testing be done prior to future releases.
Change Analysis is especially helpful for software teams because so many production problems occur after updates, migrations, or configuration changes.
6. Scatter Diagram
The scatter diagram is a data-based root cause analysis tool used to determine the relationship between two variables.
Rather than opinions alone, teams look at real patterns in data.
It helps to answer questions like:
- Does changing one thing change another?
- Is there a relation between two things?
- Is the suspected cause really driving the problem?
Example of a Scatter Diagram
The company observes an increase in customer complaints.
The team suspects longer delivery times could be the reason.
They differ:
- Delivery time
- Complaints number
The scatter plot shows that as delivery time increases, the number of complaints increases.
Therefore, late deliveries are associated with customer dissatisfaction.
But correlation isn't always causation.
The team should do scatter analysis and other types of root cause analysis to verify the actual cause.
7. 8D Problem Solving
8D (Eight Disciplines) is a systematic approach to problem solving and is used extensively in manufacturing, automotive, and quality management.
It offers a step-by-step framework for identifying, correcting, and preventing problems.
The eight disciplines are:
D1: Build a Team
Create a group of people who understand the problem.
D2: State the Problem
Clearly define:
- What was it?
- Where did it happen?
- When did this happen?
- And how often does that happen?
D3: Make Temporary Actions
Implement temporary fixes to manage the issue.
D4: Pinpoint the Root Cause
Use tools such as:
- 5 Whys
- Fishbone Diagram
- Data analysis
D5: Identify Permanent Corrective Actions
Address the root cause by implementing solutions.
D6: Solution validation
Confirm effectiveness of corrective action.
D7: Avoid Recurrence
Enhance documentation and training processes.
D8: Identify the Team
Learn from the documents. Credit the people who made them.
8D Example
A supplier delivers defective parts to a manufacturer.
Immediate Action:
The company separates the defective products.
Investigation:
The team uses a fishbone diagram to identify inconsistent procedures for supplier inspection.
Corrective measures:
The supplier is improving the quality checks better.
Preventive measures:
Added future supplier audits.
8D is useful for complicated problems that require teamwork and documentation.
8. Barrier Analysis
Barrier analysis looks at why the existing controls did not prevent a problem from occurring.
The method analyses:
- What walls were supposed to prevent the failure?
- What tore down those barriers?
- How to improve them?
It is used in:
- Safety investigations
- Health care
- Air Transport
- Security Operations
Barrier Analysis Example
Issue:
Employee accesses confidential information without authorisation.
Anticipated barriers:
- Permissions
- User Sign In
- Security surveillance
The investigation shows:
The employee’s transfer into another department did not revoke the employee’s access rights.
Reason:
Poor employee access management process.
Corrective action:
- Automate reviews of permissions.
- Develop processes to modify employee roles.
- Conduct regular security audits.
The Barrier Analysis approach allows organizations to fix systems, not people.
Worked Example: Solving One Problem With Two RCA Techniques
Now let’s take a look at how different root cause analysis techniques can be used to investigate the same issue.
Problem:
An online store has a customer complaining about the late delivery of orders.
Step 1: Identify the Issue
The team forms a clear problem statement:
“Customers are complaining and asking for refunds because their orders are arriving 3-5 days later than the promised delivery date.”
A good problem statement should have:
- Special edition
- Impact
- Frequency
- Location or affected process
Do not use vague statements such as:
“Delivery sucks”.
Step 2: Use 5 Whys
The team asks:
Why are the orders delayed?
Because shipments are leaving the warehouse late.
Why do shipments get delayed?
Because the order processing is not quick enough.
Why aren’t orders processed quickly?
Because employees manually check inventory availability.
Why is stock verification performed manually?
Because the warehouse system is not linked with the online store.
Why isn't there a system integration?
The company never implemented an automated inventory management process.
Root cause:
Inventory and order management systems are not integrated.
Step 3: Use a Fishbone Diagram
The team develops a fishbone diagram to identify other possible causes.
People
- Staff short
- No training required
Process
- Manual Approvals
- Inefficient process flow
Technology
- Old stock system
- No automation
Measurement
- No performance tracking for delivery
Environment
- Issues with warehouse layout
The team identifies technology and process issues as the primary contributors.
Step 4: Confirm the Suspected Root Cause
The team verifies the findings before making changes.
They:
- Check the order processing data.
- Compare automated vs. manual orders.
- Integration-test the system.
The data confirms that manual stock counts are a major source of delays.
Corrective measure:
Automatically synchronise stock.
Preventive action:
Perform regular system performance reviews.
How to Run a Root Cause Analysis Session Step by Step?
There’s a process for successful RCA sessions. Without a clear process, teams can spend hours talking about opinions rather than solutions.
Identify the Problem Statement
The first thing is to clearly articulate the problem.
A strong problem statement addresses:
- What’s going on?
- Where did it happen?
- When was it?
- What effect?
Example:
Weak statement:
“The website is broken.”
Powerful statement :
After the latest website update, the checkout page was broken for mobile users from 10 AM to 12 PM.
With the second statement, the team has something tangible to explore.
Collect Evidence and Create a Timeline
Don’t rely on assumptions alone.
Collect:
- System logs
- Customer comments
- Process documents
- Performance information
- Records from a past incident
Make a timeline. This can help you see what happened before and after the failure.
Example:
10:00 AM – Patch shipped.
10:15 AM — Error rates are going up.
10:30 AM — The first customer complaints began to come in.
11:00 AM — Support team reports checkout failures.
This timeline helps to connect events and to see possible causes.
Identify and Validate Root Cause
After you have identified the likely cause, confirm it with data.
A suspected root cause should:
Explain why this problem happen?
- Match available data.
- Be something the organization controls.
- Prevent recurrence when fixed.
Look into it; don’t just take the first explanation without investigation.
Implement and Monitor Corrective Actions
That's only half the battle: finding the root cause.
The final step is to make sure the solution works.
Teams need to:
- Take corrective action.
- Measure results.
- Check performance.
- Procedures for updating.
- Document lessons learnt.
If you do a good RCA, the same problem won’t come back.
Common RCA Mistakes That Lead to the Wrong Fix
Even experienced teams can make mistakes in root cause analysis.
1. Pausing at the First Cause
The first explanation is not necessarily the reason.
For example:
Problem:
Employees make data entry mistakes.
Reason:
Workers are careless.
Potential root cause:
The system architecture allows for human errors.
2. Blame the People, Not the Processes
Most problems stem from system weaknesses, unclear processes or lack of controls.
A strong RCA is about improving systems, not assigning blame.
3. Using Opinions Rather than Data
Investigation is made effective by evidence.
Useful resources include:
- Reports
- Logs
- Metrics
- Customer Comments
- Documentation of processes
4. Selecting the Wrong RCA Method
No need for an elaborate analysis for a simple problem.
Likewise, a major system failure may need more than basic questioning.
The quality of investigations is improved by using appropriate root cause analysis methods.
How Root Cause Analysis Is Used in Six Sigma, ITIL and Agile?
RCA is not industry-specific. Root cause analysis is used to improve quality and performance in various frameworks.
RCA in Six Sigma DMAIC
Six Sigma uses RCA mainly in the Analyse phase of the DMAIC methodology.
DMAIC is an acronym for:
- Describe
- Gauge
- Discover
- Upgrade
- Control
During the Analyse phase, the teams will find the root causes of defects or inefficiencies.
Common tools are:
- Fishbone diagram
- Pareto analysis in Six Sigma
- 5 Whys
- Regression analysis
For professionals who are working on process improvement, understanding the DMAIC methodology links RCA to broader quality improvement practices.
The Six Sigma team may use:
- Pareto analysis to determine major defect categories
- Fishbone analysis to investigate causes.
- 5 Whys to find the root cause problem with the process.
RCA in ITIL Problem Management
In IT service management, RCA is formalised as Problem Management, a practice covered in the ITIL 4 Foundation certification. It aims to find the underlying cause of recurring incidents instead of closing tickets one by one.
For example:
Incident:
Users are unable to use a service.
Fast incident management brings back service.
Problem management takes into account:
Why was that?
How do you prevent it from happening again?
IT teams often use:
- Timeline analysis
- Fault Tree Analysis
- Analysis of Change
- 5 Why’s
RCA in Agile Retrospective
Agile teams often use RCA during retrospectives to improve work processes.
Rather than asking,
“Who’s done this to us?”
Teams ask:
“What process improvement will stop this issue?”
Examples:
- What went wrong with the sprint?
- Why were bugs discovered late?
- Why did communication break down?
Agile teams usually run RCA inside the sprint retrospective, using
- 5 Why's
- Fishbone diagram
- Discussions in teams
At scale, SAFe builds RCA into the problem-solving workshop held during Inspect and Adapt, where whole Agile Release Trains use fishbone and Pareto together.
Root Cause Analysis vs. Corrective and Preventive Action (CAPA)
Root cause analysis and corrective and preventive action (CAPA) are related, but they serve different purposes.
Many organizations use both together. RCA identifies why a problem occurred and CAPA outlines what actions should be taken to resolve the problem and prevent it from recurring.
Think of it like this:
- Root Cause Analysis says, “Why did this problem happen?
- CAPA answers: "What are we going to do about it?
Summary
Root cause analysis techniques provide a structured way for organizations to address problems permanently rather than continually treating symptoms.
Whether the team is using 5 Whys, fishbone diagram root cause analysis, FMEA, Fault Tree Analysis, or 8D problem solving, they all have the same goal: find the root cause of a failure and prevent the failure from happening again.
The best RCA approach depends on the problem's complexity and nature.
5Whys can quickly uncover process gaps for simple problems. For complex problems with many factors, a fishbone diagram, FMEA, or Fault Tree Analysis can be used for a deeper investigation ..
Successful organizations don’t wait until problems happen. They build systems to help stop those problems from happening again.
Root cause analysis is often paired with continuous improvement frameworks like Six Sigma, ITIL and Agile to help teams become more efficient, reduce waste, and develop more reliable processes.
If you are looking to sharpen up your practical problem solving skills and see how professionals use RCA methods in real-life scenarios, then exploring a structured root cause analysis training program can help you build a stronger foundation.









 Lowest-Price Challenge











 Personalized Path


.webp)


 USA
USA  Canada
 India
India UK
UK Australia
 Singapore


