


 Call Us





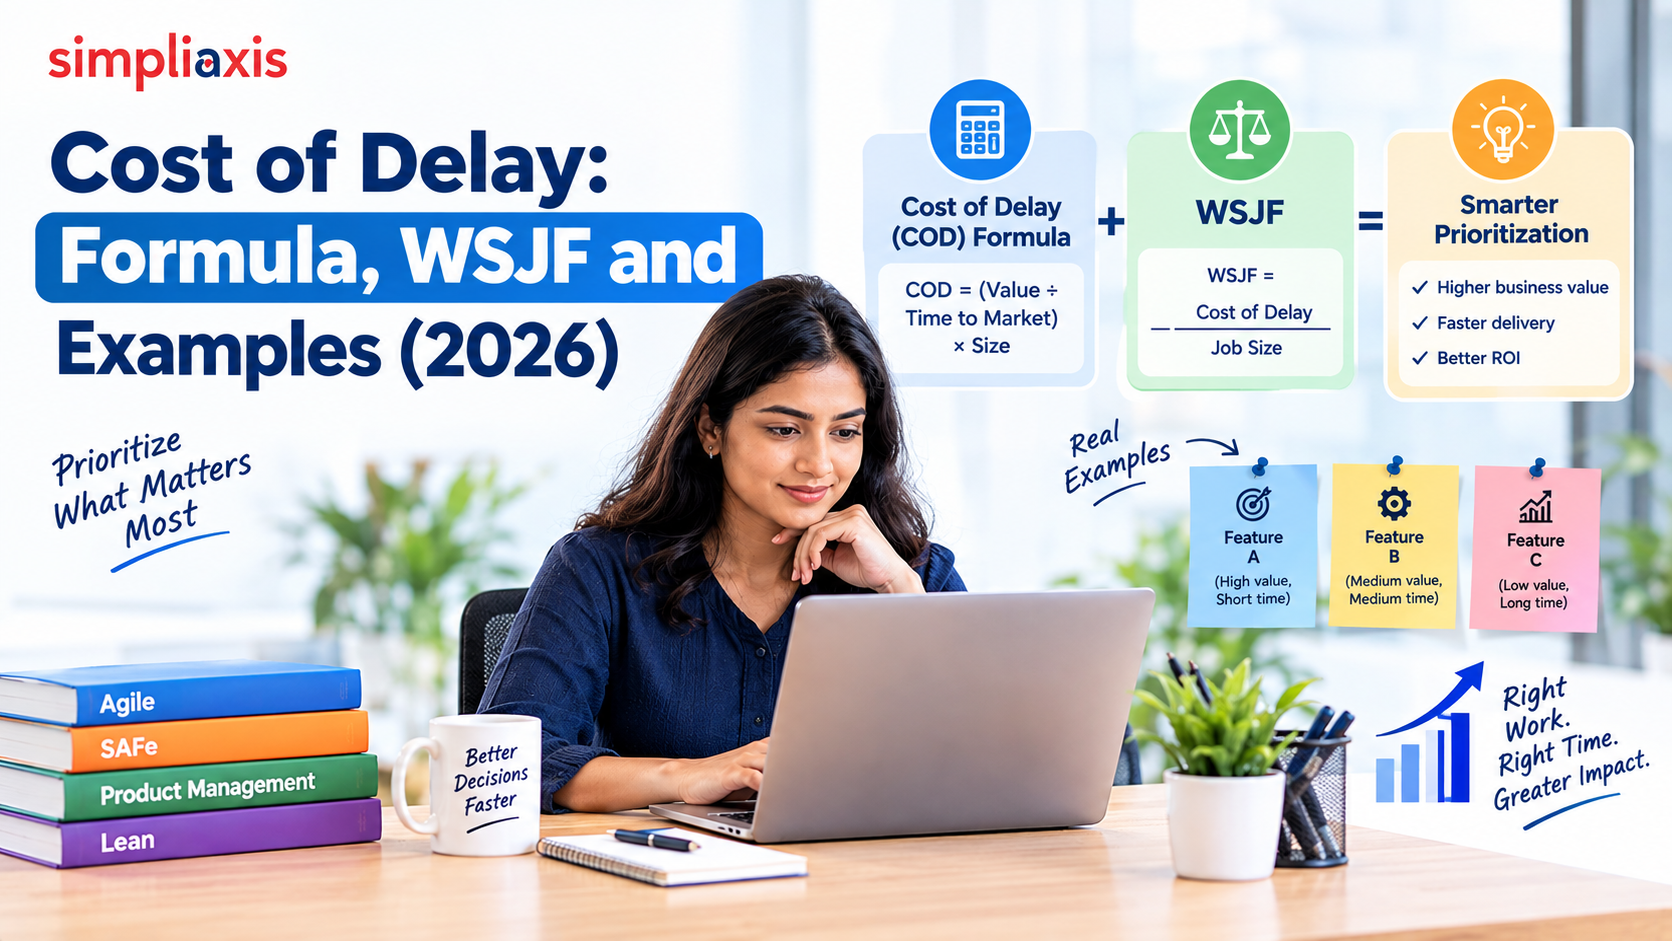
Cost of delay is the money or value you lose for every unit of time a product, feature, or project is late. You calculate it by estimating the value lost per week or month. In SAFe, you combine user-business value, time criticality, and risk reduction or opportunity enablement, then divide by job size to get the WSJF score. The highest score goes first.
Key Highlights of Cost of Delay
- Cost of delay (CoD) puts a price on waiting. It is the value lost per unit of time.
- SAFe splits it into three parts: user-business value, time criticality, and risk reduction or opportunity enablement.
- WSJF equals CoD divided by job size. CD3 equals CoD divided by duration.
- Small, valuable, urgent jobs move to the top of the backlog.
- Relative scoring works well when you have no hard financial data.
- Delay curves come in different shapes: standard, fixed-date, urgent, and expedite.
- Review your estimates often. Stale assumptions lead to poor sequencing.
Introduction
Every backlog is a queue. Every item in that queue is waiting for someone to start it. That wait is not free.
Most teams still decide what to build first by opinion. The loudest stakeholder wins. The biggest customer wins. Or the item with the lowest build cost wins. None of these methods looks at the economics of time.
Cost of delay fixes this. It asks a simple question: what do we lose each week if this item is not live? Once you have an answer, the debate changes. You stop arguing about who is right. You start comparing numbers.
This guide explains the idea in plain language. You will learn the formula, the three components, and the link to WSJF and CD3. You will also see worked examples, common mistakes, and best practices. If you work in product management, SAFe, or agile delivery, this will help you sequence work with confidence in 2026.
What Is Cost of Delay?
Cost of delay is a way to measure the price of waiting. It turns time into a number that everyone can discuss. It sits at the heart of modern feature prioritization androadmap planning.
Definition: The Economic Impact of Time
Cost of delay is the economic impact of not having something today. Suppose a new checkout feature will add ₹4 lakh in monthly revenue. If it ships one month late, you lose ₹4 lakh. That loss is the delay cost.
The loss is not always revenue. It can be a lost customer, a missed deadline, a fine, or a competitor gaining ground. It can also be a risk that grows every week you ignore it.
The core idea is simple. Value has a time dimension. A feature that ships early earns more than the same feature shipped late.
How Cost of Delay Combines Value and Urgency?
Two things drive the number. The first is value. How much benefit does the item create once it is live? The second is urgency. How fast does that benefit disappear if you wait?
A high-value item with no urgency can wait. A modest item with a hard deadline cannot. Cost of delay captures both in a single figure.
Think of a seasonal product. A festive-season campaign tool has moderate value all year. But in the weeks before the festival, its value spikes. After the festival, it drops to almost nothing. Value alone does not explain this. Urgency does.
Why Is It Expressed as Money per Unit of Time?
Cost of delay is expressed as a rate. It is money per week or money per month. The unit matters because it lets you compare items fairly.
A total figure such as ₹10 lakh tells you little. Is that over a month or a year? A rate such as ₹2 lakh per week tells you exactly how fast the loss builds up. It also lets you multiply by the length of the delay to get the total cost.
Most teams choose a unit that matches their planning cadence. Weekly works well for fast product teams. Monthly suits longer programs.
The 3 Components of Cost of Delay
SAFe breaks the concept into three parts. Each part answers a different question. Together they give a fuller picture than value alone. You can read more about how value is defined in theScaled Agile Framework business value guide.
User-Business Value
This is the benefit the item delivers to users and to the business. Will customers prefer it? Will it raise revenue? Will it cut costs or improve retention?
Teams often score this by comparing items to each other. One feature might have a value of 13 and another a value of 5. The numbers are relative. What matters is the gap between them.
Ask questions such as:
- How many users does it affect?
- How much does each user gain?
- Does it improve revenue, margin, or satisfaction?
Time Criticality
Time criticality asks how quickly the value decays. Is there a fixed date? Is there a launch window? Will a competitor get there first?
An item with a regulatory deadline has high time criticality. So does a feature tied to a product launch or a seasonal event. An internal tool that could ship any quarter has low time criticality.
This is the part teams forget most often. They rate value carefully and ignore the clock. The result is a backlog sorted by importance, not by economics.
Risk Reduction and Opportunity Enablement
The third component covers indirect value. Some work does not earn money today. It lowers a risk or opens a door.
Risk reduction includes security fixes, compliance work, and removing technical debt. Opportunity enablement includes platform work that lets you build new products faster. A new data pipeline may not delight users. But it might unlock five features next quarter.
This component protects important enabling work from being pushed aside by flashy features.
How to Calculate Cost of Delay?
There is no single correct method. The right approach depends on the data you have. Some teams work in currency. Others work in relative points. Both are valid.
Estimating Value Lost per Time Period
Start with the cost of delay formula in its simplest form:
Cost of delay = value lost per unit of time
A four-step process works well. It follows the pattern many practitioners use:
- Estimate the total value the item will deliver, such as annual revenue or savings.
- Choose a time unit that matches your planning cadence.
- Convert the value to a rate. Divide annual value by 52 for weekly or 12 for monthly.
- Adjust for urgency, such as a deadline or a closing market window.
Here is a quick example. A pricing tool will add ₹52 lakh a year in margin. Divide by 52. The weekly cost of delay is ₹1 lakh. If the tool is six weeks late, you lose ₹6 lakh.
This is a rough figure. That is fine. A rough number beats no number.
Using Relative Estimation When Numbers Are Unavailable
Many teams cannot put a rupee value on every item. This is normal, especially for internal or enabling work. In this case, use relative estimation.
Pick a scale. The modified Fibonacci sequence is common: 1, 2, 3, 5, 8, 13, 20. Find the smallest item in the backlog for each component and give it a 1. Then rate everything else against it.
Relative scoring has two benefits. It is fast, and it forces a comparison. When a team argues whether something is an 8 or a 13, they surface hidden assumptions. That conversation is often more useful than the score.
Combining the Three Components Into One Figure
In SAFe, the cost of delay calculation is a simple sum:
CoD = User-Business Value + Time Criticality + Risk Reduction/Opportunity Enablement
Take a feature with a value of 8, time criticality of 5, and risk reduction of 3. Its CoD is 16.
Notice that the sum keeps all three factors visible. A low-value item can still score well if it is urgent or if it reduces a serious risk. This is the point of the model.
Cost of Delay and WSJF in SAFe
SAFe uses CoD as the top half of a fraction. The bottom half is the size of the job. This fraction is WSJF. If you are new to the framework, start withwhat the Scaled Agile Framework.
Weighted Shortest Job First Explained
Weighted Shortest Job First is a prioritization model that sequences work for maximum economic benefit. SAFe describesWSJFas the relative cost of delay divided by the relative job duration.
The name says it all. Do the shortest jobs first, but weigh them by their value. A short job with tiny value is not a priority. A short job with high delay cost is.
The idea comes from queueing theory and was popularized in product development by Don Reinertsen. SAFe adopted it as its main tool for WSJF prioritization at the program and portfolio levels. For a deeper look at scoring and limits, see thisWSJF guide
WSJF = Cost of Delay Divided by Job Size
Here is the full formula:
WSJF = (User-Business Value + Time Criticality + Risk Reduction/Opportunity Enablement) ÷ Job Size
Job size is a stand-in for duration. For a team with stable capacity, a bigger job takes longer. So SAFe uses size as a proxy.
This is where the WSJF cost of delay thinking pays off. Dividing by job size means a moderately valuable two-week job can outrank a very valuable six-month job. The math rewards speed and value together.
Why the Shortest, Highest-Value Jobs Go First?
Why not simply do the most valuable job first? Because a long job blocks the queue. While it runs, every smaller item waits. The total delay cost across the whole backlog rises.
Doing short, high-value jobs first releases value early. It also frees capacity sooner. Then the team moves on to the next item.
A supermarket checkout works the same way. If one customer has a full trolley and five have a single item, serving the small baskets first cuts the total waiting time. Most people leave sooner. The one big trolley waits a little longer.
CD3: Cost of Delay Divided by Duration
CD3 is a close cousin of WSJF. It uses the same logic, with duration rather than size in the denominator. Many practitioners prefer it because it stays closer to real money and real time.
The Origins of CD3 and Its Link to WSJF
Black Swan Farming, led by Joshua Arnold, popularized CD3. It describes CD3 as one specific form of the WSJF queuing method. The name keeps the cost of delay in the title and reminds teams that the divider is duration.
So how do the two differ? In practice, CD3 usually starts with a currency-based CoD and a time-based duration. WSJF in SAFe often uses relative points for both. The arithmetic is the same.
CD3 also encourages smaller batches. Because duration is in the denominator, splitting work into smaller pieces raises the score for each piece. That pushes teams toward faster flow.
A Worked Calculation Comparing Two Features
Let us compare two features using the cost of delay divided by duration.
| Feature | CoD per week | Duration | CD3 score |
| Feature X: Loyalty dashboard | ₹2,00,000 | 10 weeks | 20,000 |
| Feature Y: One-click reorder | ₹90,000 | 3 weeks | 30,000 |
Feature X has the higher weekly CoD. But Feature Y has the higher CD3 score. It is cheaper to wait on X than to delay Y.
Now check the total loss for each order:
- Y first, then X: X waits 3 weeks. Loss = 3 × ₹2,00,000 = ₹6,00,000.
- X first, then Y: Y waits 10 weeks. Loss = 10 × ₹90,000 = ₹9,00,000.
Sequencing by CD3 saves ₹3,00,000. The higher score gave the cheaper order.
Reading CD3 to Sequence the Backlog for Flow
CD3 is only useful if you act on it. Sort the backlog by score, highest first. Then start at the top.
A few reading tips help:
- A high score means high value per unit of time occupied.
- A low score does not mean the item is bad. It means other items should go first.
- Use the longest team duration when several teams work in parallel. Do not add them up.
- If items depend on one another, add the durations of the parts that cannot run in parallel.
Use CD3 as a guide, not a rule. It sets the default order. Dependencies and capacity may change it.
Cost of Delay Example: Step-by-Step Calculation
Let us walk through a full cost of delay example. Imagine a SaaS product team planning next quarter. The product roadmap has four candidate features.
Step 1: List the candidates.
- A: Self-serve invoice download
- B: GST compliance update
- C: New analytics module
- D: Mobile app redesign
Step 2: Score the three components. Use the Fibonacci scale, comparing each item to the others.
| Feature | Value | Time criticality | Risk/Opportunity | CoD |
| A: Invoice download | 5 | 3 | 2 | 10 |
| B: GST update | 3 | 13 | 8 | 24 |
| C: Analytics module | 13 | 5 | 5 | 23 |
| D: Mobile redesign | 8 | 3 | 3 | 14 |
Step 3: Estimate job size. Use the same scale. The team rates effort relative to the smallest job.
| Feature | Job size |
| A | 2 |
| B | 5 |
| C | 13 |
| D | 8 |
Step 4: Divide.
| Feature | CoD | Job size | WSJF |
| A: Invoice download | 10 | 2 | 5.0 |
| B: GST update | 24 | 5 | 4.8 |
| C: Analytics module | 23 | 13 | 1.8 |
| D: Mobile redesign | 8 + 3 + 3 = 14 | 8 | 1.75 |
Step 5: Sequence. The order is A, B, C, D.
Look at what happened. The analytics module had a high value of 13. Yet it ranks third because it is large. The invoice download had a modest value but is tiny, so it goes first.
A and B are nearly tied. In practice, the team would check the deadline on the GST update. If a legal date is close, they may start B first. The score informs the decision. It does not replace judgment.
Patterns of Cost of Delay Over Time
The cost of delay is not always a steady drip. Its shape changes from item to item. Reinertsen named several profiles, and practitioners often work with four.
Fixed-Date, Urgent, Expedite, and Standard Profiles
| Profile | How the cost behaves | Typical example |
| Standard (linear) | Steady loss for every period of delay | A feature that earns a fixed amount each month once live |
| Fixed date | Little cost until a deadline, then a cliff | A compliance change due on a regulatory date |
| Urgent or expedite | Very high cost from day one | A production outage or a closing market window |
| Intangible | Low now, rising later, hard to quantify | Technical debt or a usability gap that compounds |
How does the Shape of the Curve Change Prioritization?
The shape changes when you should start.
- Standard items follow the WSJF ranking. Each week of delay costs the same.
- Fixed-date items can wait, but only until the last responsible moment. Start too late, and you pay the cliff. Start too early, and you waste capacity that could go elsewhere.
- Expedite items jump the queue. They justify interrupting other work.
- Intangible items need attention before the cost surfaces. Otherwise, they become emergencies later.
Benefits of Using Cost of Delay
Teams that adopt CoD thinking report clearer conversations and better flow. The benefits show up in planning, delivery, and stakeholder trust.
1. Shifts Debate From Opinion to Economics
Without numbers, prioritization becomes politics. Each stakeholder argues for a favorite. The seniors usually win.
With CoD, the question changes. Instead of "who wants this most?", the team asks "what does waiting cost?" That question has an answer that can be tested.
The result is calmer meetings. People challenge assumptions, not each other.
2. Improves Flow and Reduces Total Delay Cost
Sequencing by WSJF or CD3 lowers the total cost of waiting across the backlog. As the earlier example showed, the right order can save lakhs of rupees without any extra effort.
It also nudges teams to break work into smaller batches. Smaller batches move faster. They give earlier feedback and reduce risk. This ties well with otheragile prioritization techniquesthat focus on flow.
3. Aligns Product, Business, and Engineering
Each group sees a different part of the picture. The product knows the users. The business knows revenue and deadlines. Engineering knows effort and risk.
The three-part model gives each group a voice. Business scores value and time criticality. Engineering scores job size and risk. Product facilitates. Everyone sees how the final number was built.
This shared language helps a product owner defend the roadmap. Professionals who want to build this skill can exploreSAFe POPM certification training.
Common Mistakes and Limitations
CoD is powerful, but it is easy to misuse. Watch for these traps.
1. False Precision in Delay Estimates
A figure like ₹1,87,342 per week looks scientific. It is almost certainly wrong. Estimates about future revenue are guesses.
Do not chase decimal points. Use ranges or relative scores. The goal is to rank items correctly, not to predict accounts to the rupee.
Also beware of gaming. If teams know the score decides the outcome, they may inflate the numbers for their pet project. Score in a group and challenge outliers.
2. Ignoring Time Criticality and Risk Reduction
Many teams score only value. They skip the other two parts because they feel harder to define. This turns WSJF into a value-versus-effort matrix with extra steps.
A value vs effort matrix is a useful quick tool. But it has no clock. It cannot tell you that one item loses half its worth next month. The full model can.
Enabling work also suffers. Platform upgrades and security fixes look weak on value alone. Scoring risk reduction gives them a fair chance.
3. Not Revisiting Assumptions
Scores age fast. A competitor launches. A regulation changes. A customer churns. The CoD you set in January may be wrong by March.
Treat the score as a living number. Review it at each planning cycle. Rescore the top items when the context shifts. Otherwise, the backlog becomes a record of old beliefs.
Best Practices for Applying Cost of Delay
Follow these habits to get real value from the method.
- Start simple. Use relative scoring first. Move to currency only when you have reliable data.
- Score together. Bring product, business, and engineering into one session. Different views improve accuracy.
- Use a reference item. Anchor each scale to the smallest item so scores stay consistent.
- Score one component at a time. Rate value for every item, then time criticality, then risk. This avoids halo effects.
- Break large items down. Smaller jobs score higher and flow faster.
- Plot delay curves for big bets. Check whether an item is standard, fixed-date, or urgent.
- Compare methods. Cross-check WSJF against theRICE prioritization framework. RICE scores include reach, impact, confidence, and effort. It has no explicit time factor. WSJF adds the urgency view. Using both can reveal blind spots. For a simpler categorical approach, see WSJF vs MoSCoW.
- Keep human judgment. Use the score to start a discussion, not to end it.
- Review often. Rescore at each PI Planning event or planning increment.
- Explore related methods. The guide onfeature prioritizationcovers other options that pair well with CoD.
A quick note on tools. Any spreadsheet works. Create columns for the three components, the CoD sum, the job size, and the WSJF result. Sort descending. That is enough to begin.
Conclusion
Cost of delay gives teams a common language for the price of waiting. It brings value, urgency, and risk into a single view. When you divide it by job size or duration, you get WSJF and CD3. Both point to the same principle: do the short, valuable, urgent work first.
You do not need perfect data. Rough numbers and honest debate are enough to improve your sequencing. Revisit the scores often, check the shape of each delay curve, and stay alert to false precision.
If you want to turn these ideas into a career skill, Simpliaxis can help. Its SAFe Product Owner/Product Manager (POPM) certification training teaches WSJF, backlog prioritization, and roadmap planning through practical exercises. Explore theSAFe POPM certification course and learn to prioritize with confidence. Start today, and make every week of your roadmap count.








 Lowest-Price Challenge











 Personalized Path


.webp)


 USA
USA  Canada
 India
India UK
UK Australia
 Singapore


