


 Call Us


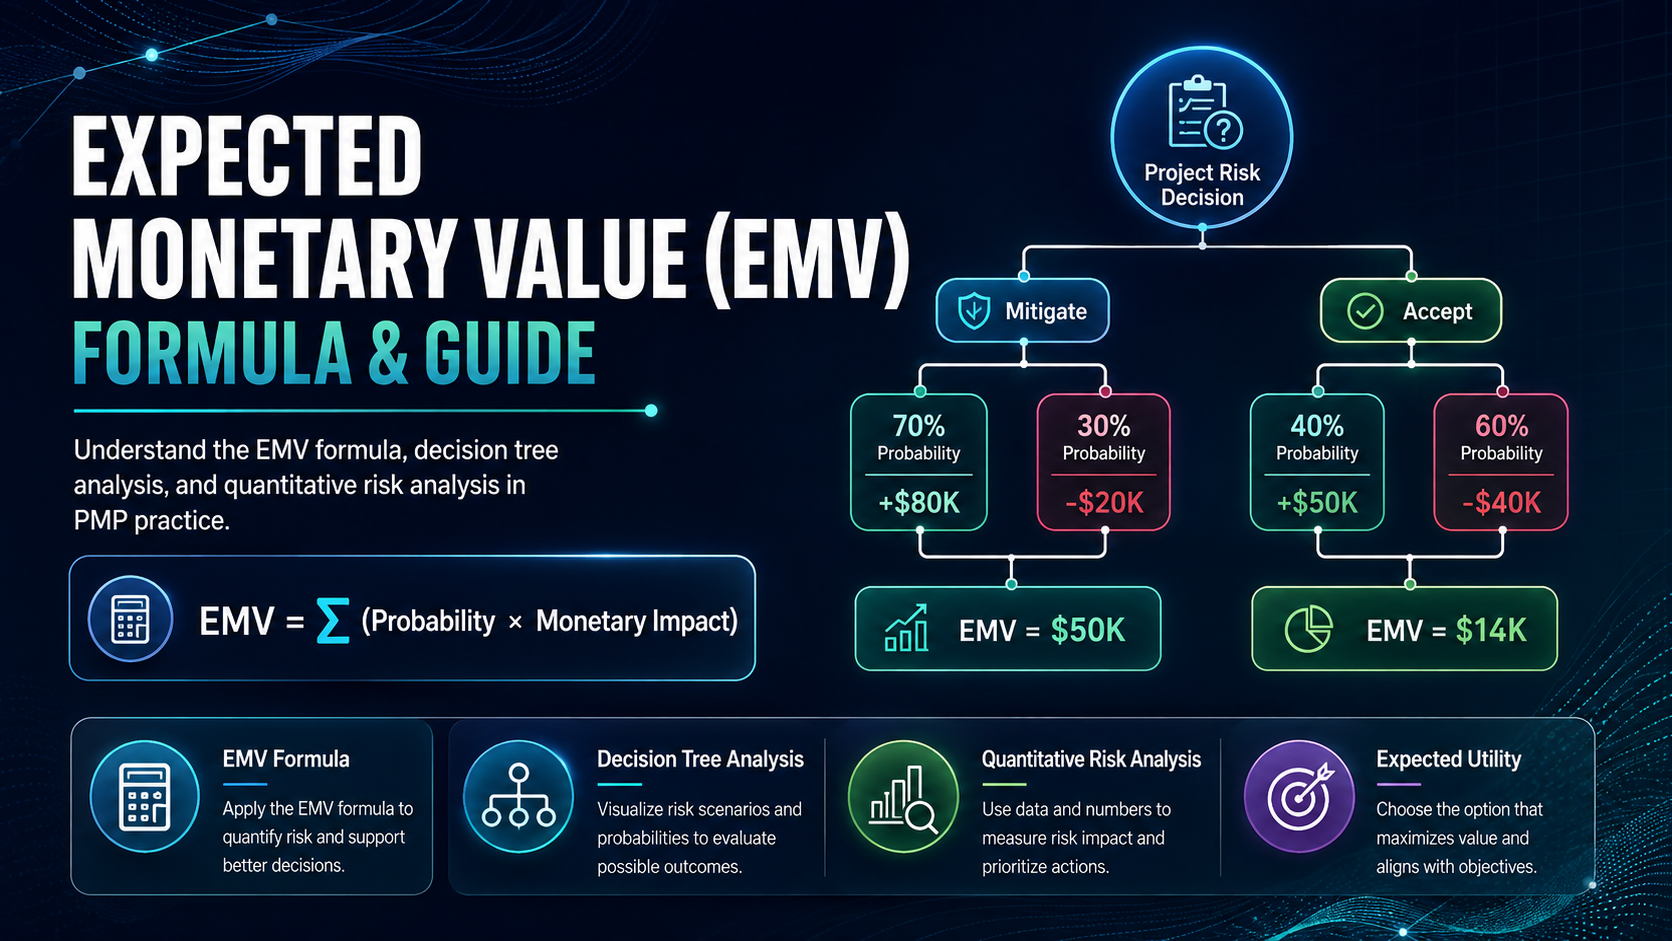
Expected Monetary Value (EMV) is a quantitative risk analysis technique that multiplies the probability of an outcome by its monetary impact to produce a single weighted value, letting project teams compare uncertain options on a common financial basis. It is most often applied inside a decision tree, where EMV is calculated for each branch and the branch with the best value guides the decision. EMV is tested on both the PMP and PMI-RMP exams and is not the same technique as Earned Value Management (EVM), despite the similar-looking acronym.
Key Highlights: What Is Expected Monetary Value?
- EMV = Probability x Impact, summed across every possible outcome of a risk or decision branch.
- Decision trees apply EMV visually, and can run to multiple stages when one decision depends on the outcome of an earlier one.
- The branch with the highest EMV is not automatically the "right" answer; risk-averse decision-makers often prefer expected utility over raw EMV.
- EMV is one of the most confused PMP acronyms, routinely mixed up with EVM (Earned Value Management), a completely unrelated technique.
- AI-assisted risk platforms now suggest probability estimates from historical portfolio data, but impact estimation on novel risks and the risk-attitude judgement remain human calls.
- EMV totals commonly anchor the starting estimate for a project's contingency reserve.
What Is Expected Monetary Value?
Expected Monetary Value is the probability-weighted average outcome of an uncertain event, expressed in currency. The Project Management Institute frames quantitative risk assessment as a way of converting uncertainty into a number a sponsor or finance lead can act on, rather than leaving a decision to a qualitative "high, medium, low" gut call. A project manager identifies a risk or decision outcome, estimates the probability it happens, estimates the monetary effect if it does, and multiplies the two. Run across every line of a risk register, the summed EMVs give the project's overall quantified risk exposure. The technique itself predates project management frameworks; it is a standard tool from decision theory that PMI adopted because it turns a vague "this feels risky" assessment into a figure a finance director can actually weigh against a budget. Threats are entered as negative values and opportunities as positive ones, so the total can net out favourably or unfavourably depending on what the project is actually carrying.
How to Calculate EMV: A 4-Step Formula
EMV = Probability x Impact. Where a single risk has more than one possible outcome, each outcome gets its own EMV and the results are summed:
Total EMV = (P1 x I1) + (P2 x I2) + (P3 x I3)
- List every possible outcome for the risk or decision, making sure the outcomes are mutually exclusive so probabilities do not overlap.
- Assign a probability to each outcome, expressed as a decimal, so the probabilities for one risk sum to 1.0 (100%).
- Estimate the monetary impact of each outcome, recording threats as negative figures and opportunities as positive ones.
- Multiply and sum: multiply each outcome's probability by its impact, then add the results together to get the total EMV.
| Term | What It Means | Formula or Rule |
|---|---|---|
| EMV (single outcome) | Weighted value of one possible outcome | Probability x Impact |
| EMV (multiple outcomes) | Weighted value across all outcomes of one risk | Sum of (Probability x Impact) for each outcome |
| Threat EMV | Cost the project could incur | Recorded as a negative value |
| Opportunity EMV | Benefit the project could gain | Recorded as a positive value |
| Decision tree rollback | Calculating a tree from the end nodes backward to the decision node | Multiply terminal value by cumulative path probability, sum per branch |
Worked Example: A Data Migration Vendor Decision
A mid-size insurer is choosing between two vendors to migrate a policy administration system. Vendor A quotes a fixed price of $420,000 but has a 30% chance of a scope-related delay estimated at $150,000 in extended internal support and contractor overlap. Vendor B quotes $460,000 but, based on its delivery history on comparable migrations, has only a 10% chance of the same type of delay, estimated at $100,000 if it occurs.
Vendor A: $420,000 base cost, plus risk EMV of 0.30 x $150,000 = $45,000, giving a risk-adjusted expected cost of $465,000.
Vendor B: $460,000 base cost, plus risk EMV of 0.10 x $100,000 = $10,000, giving a risk-adjusted expected cost of $470,000.
On sticker price alone, Vendor A looks $40,000 cheaper. Once each vendor's delay risk is folded in, the gap narrows to $5,000, which is close enough that a team weighing the tighter outcome spread on Vendor B's side may reasonably choose the higher-quoted vendor anyway. EMV does not just rank options; it puts a number on how much a specific risk is actually worth to the decision.
Decision Tree Analysis: Visualising EMV Across Competing Options
A decision tree lays the same logic out as a branching diagram. A square decision node marks a choice the project team controls; circular chance nodes branch out from it to show possible outcomes and their probabilities, ending in terminal values. Working backward from those end nodes, a step called "rolling back" the tree, the analyst multiplies each terminal value by its cumulative path probability, sums each branch, and compares the EMV of the original decision options against each other.
Multi-Stage Decision Trees: When One Decision Depends on Another
Most introductory guides stop at a single decision with a handful of parallel outcomes. In practice, many real project decisions are sequential: an early, cheaper decision changes the probabilities or costs of a later, bigger one. A common example is deciding whether to run a pilot before committing to a full rollout.
Suppose a logistics company is deciding whether to roll out a new routing algorithm across its whole fleet, costing $500,000, with a 50% chance of achieving $900,000 in fuel savings and a 50% chance of only $100,000 in savings due to regional routing quirks the algorithm handles poorly.
Path 1, roll out directly: EMV = (0.5 x $900,000) + (0.5 x $100,000) - $500,000 = $0.
Path 2, run a $60,000 regional pilot first. The pilot reliably reveals which of the two scenarios the full rollout would land in before the company commits the larger spend. If the pilot indicates the high-savings scenario (a 50% chance), the company proceeds with the full rollout: $900,000 savings, minus the $500,000 rollout cost, minus the $60,000 already spent on the pilot, nets $340,000. If the pilot indicates the low-savings scenario (the other 50% chance), the company cancels the rollout entirely, avoiding the $500,000 spend, and is left with only the $60,000 pilot cost as a loss.
Rolling the tree back: EMV of the pilot path = (0.5 x $340,000) + (0.5 x -$60,000) = $170,000 - $30,000 = $140,000. Compared with the $0 EMV of rolling out directly, the pilot path is worth $140,000 more, because the $60,000 spent buys enough certainty to avoid committing the full $500,000 to the scenario that would not have paid off. This is the practical value of a multi-stage tree: it prices out whether paying for more information before a big decision is itself worth the money, something a single-stage EMV calculation cannot show.
Why the Highest EMV Isn't Always the Right Call
EMV assumes the decision-maker is risk-neutral, and most real organisations are not. PMI's own research on decision tree analysis for risk-averse organisations points out that a risk-averse organisation facing a decision with a chance of a very large loss will often prefer expected utility, E(U), over raw EMV, because utility gives disproportionate weight to avoiding catastrophic downside rather than treating every dollar of gain or loss as equally significant. A start-up with thin cash reserves and a Fortune 500 company can face the identical EMV calculation on a risky contract bid and rationally reach opposite decisions, because the smaller company cannot absorb the low-probability, high-loss outcome even though its expected value looks fine on paper.
This is one of the most consistently underexplained points in EMV guidance aimed at exam candidates: EMV is a decision-support number, not a decision-making rule. A project manager who reports "the EMV favours Option A" without also flagging the worst-case exposure and the organisation's actual appetite for that exposure is giving the sponsor half the picture. In practice, the fix is not a more complex formula; it is a second conversation alongside the EMV number, asking the sponsor directly whether the organisation could absorb the worst-case outcome on the higher-EMV branch if it actually occurred, and treating a "no" as a legitimate reason to recommend the lower-EMV option instead.
EMV vs EVM: Do Not Confuse the Two
| Aspect | EMV (Expected Monetary Value) | EVM (Earned Value Management) |
|---|---|---|
| Purpose | Quantifies uncertain future risk and decisions | Measures actual cost and schedule performance against a baseline |
| Knowledge area | Project Risk Management | Project Cost and Schedule Management |
| Key inputs | Probability and monetary impact | Planned value, earned value, actual cost |
| Typical output | A single weighted value per risk or decision | Indices such as SPI, CPI, SV and CV |
The two are unrelated beyond the coincidence of similar acronyms, and mixing them up on the PMP exam is a well-documented, easily avoidable error. EMV also has a natural ceiling: it works well for a handful of clearly defined, mutually exclusive decisions, but it becomes unwieldy once a project is carrying dozens of smaller, interacting risks at once. At that scale, practitioners typically move from EMV and decision trees to Monte Carlo simulation to size the overall contingency reserve, since Monte Carlo captures the combined effect of many risks interacting simultaneously in a way a single decision tree cannot. Many teams also rank risks on a qualitative probability-impact matrix diagram first, reserving full EMV calculation for the handful of risks that rank high enough to justify the extra analytical effort.
How AI-Assisted Risk Tools Are Changing EMV Work in 2026
Risk and portfolio platforms in 2026 increasingly auto-populate probability estimates from an organisation's own historical delivery data instead of leaving every figure to one risk owner's judgement, and several platforms now auto-draft the decision tree structure itself once a decision is described in plain language, flagging when a proposed impact estimate is a statistical outlier against similar historical risks. What these tools do not do reliably is set the impact figure on a genuinely novel risk with no historical precedent, and they cannot decide an organisation's risk appetite for it. Choosing between the EMV-maximising branch and the expected-utility-maximising branch is a judgement about how much loss the organisation can actually absorb, which is a conversation with a sponsor or finance lead, not a calculation a model can complete on its own. Over the next few years, the mechanical multiplication side of EMV work will keep shrinking as a share of a risk practitioner's time, shifting the role's value toward framing which decisions deserve the analysis and toward the risk-attitude conversation an AI-suggested number cannot have.
Common Mistakes and Exam Traps
- Confusing EMV with EVM, an unrelated technique from a different knowledge area.
- Forgetting to record threats as negative values, which inflates the apparent overall EMV.
- Treating outcomes as mutually exclusive when they are not, which double-counts probability in a decision tree rollback.
- Reporting the highest-EMV option as automatically correct without flagging worst-case exposure or the organisation's risk appetite.
- Falling into the sunk cost fallacy by letting money already spent influence a forward-looking EMV comparison.
- Accepting an AI-suggested probability without checking whether its underlying historical data actually resembles the current risk.
- Building a single-stage tree for a decision that is really sequential, missing the chance to price out whether a cheaper pilot or information-gathering step is worth paying for first.
- Using EMV alone to justify a decision with major non-financial consequences, such as reputational or safety risk, where a purely monetary comparison understates what is actually at stake.
Practical Workplace Application
Illustrative Scenario 1: A risk-averse sponsor overrides the higher-EMV option. A biotech company's EMV analysis favours an aggressive manufacturing scale-up with an EMV of $1.2 million, against a phased scale-up with a lower EMV of $850,000. The phased option has a much narrower range of outcomes, while the aggressive option carries a 15% chance of a $4 million loss if a supply contract falls through. The sponsor, whose company has limited cash runway, chooses the phased option despite its lower EMV, a textbook example of expected utility overriding raw EMV for a risk-averse organisation.
Illustrative Scenario 2: AI-assisted portfolio risk review. A PMO analyst at a mid-size engineering firm runs a monthly review where an AI-assisted risk platform flags every open risk whose logged probability deviates significantly from the historical average for similar risk types, and pre-populates a suggested EMV for newly logged risks based on that pattern. Before the tool was introduced, the analyst spent most of a working day each month recalculating EMV line by line across the portfolio; that work is now largely automated. The analyst's job has shifted to interrogating the three or four flagged outliers each month, asking risk owners why their specific project differs from the historical pattern, and escalating the cases where the AI-suggested figure genuinely understates the exposure, such as a new regulatory risk with no comparable precedent anywhere in the firm's historical data.
Building This Skill and Where It Leads
Fluency in EMV and decision tree analysis differentiates project managers moving from execution roles into planning and portfolio roles, because it produces a defensible number a finance department will actually accept in a business case. Start by practising the single-outcome formula, then build a full risk register with probability and impact estimates on a real or practice project, then progress to rolling back multi-stage trees by hand until the calculation is second nature. Review the PMP certification syllabus to see where this sits in a structured exam-prep curriculum, and enrol in a PMI Authorized Training Partner course such as Simpliaxis's PMP certification training to work through exam-style scenarios with an instructor. Practitioners whose role is primarily risk-focused, particularly on large capital or multi-vendor programmes, often pursue PMI-RMP next; mapping a PMP certification career path toward risk-specialist roles is a natural route once EMV and decision tree analysis feel routine. As AI-assisted platforms absorb more of the mechanical probability-estimation work, the practitioners who keep the most value are the ones who can interrogate an AI-suggested number, frame the risk-attitude conversation, and present a recommendation a sponsor actually trusts.
Conclusion
Expected Monetary Value turns uncertainty into a number a sponsor can act on, and decision tree analysis is the structured way most practitioners apply that number, including across multi-stage decisions where paying for more information can itself be worth pricing out. The formula is simple, but using it well depends on honest probability and impact estimates and the judgement to know when the highest-EMV option is not the right call for an organisation's actual risk appetite. As AI-assisted platforms take over more of the historical pattern-matching that used to consume a risk practitioner's time, the practitioners who stand out will be the ones who can challenge a machine-suggested probability, know when to reach for a multi-stage tree instead of a single calculation, and own the risk-attitude conversation a model cannot have.










 Lowest-Price Challenge











 Personalized Path


.webp)


 USA
USA  Canada
 India
India UK
UK Australia
 Singapore


