


 Call Us




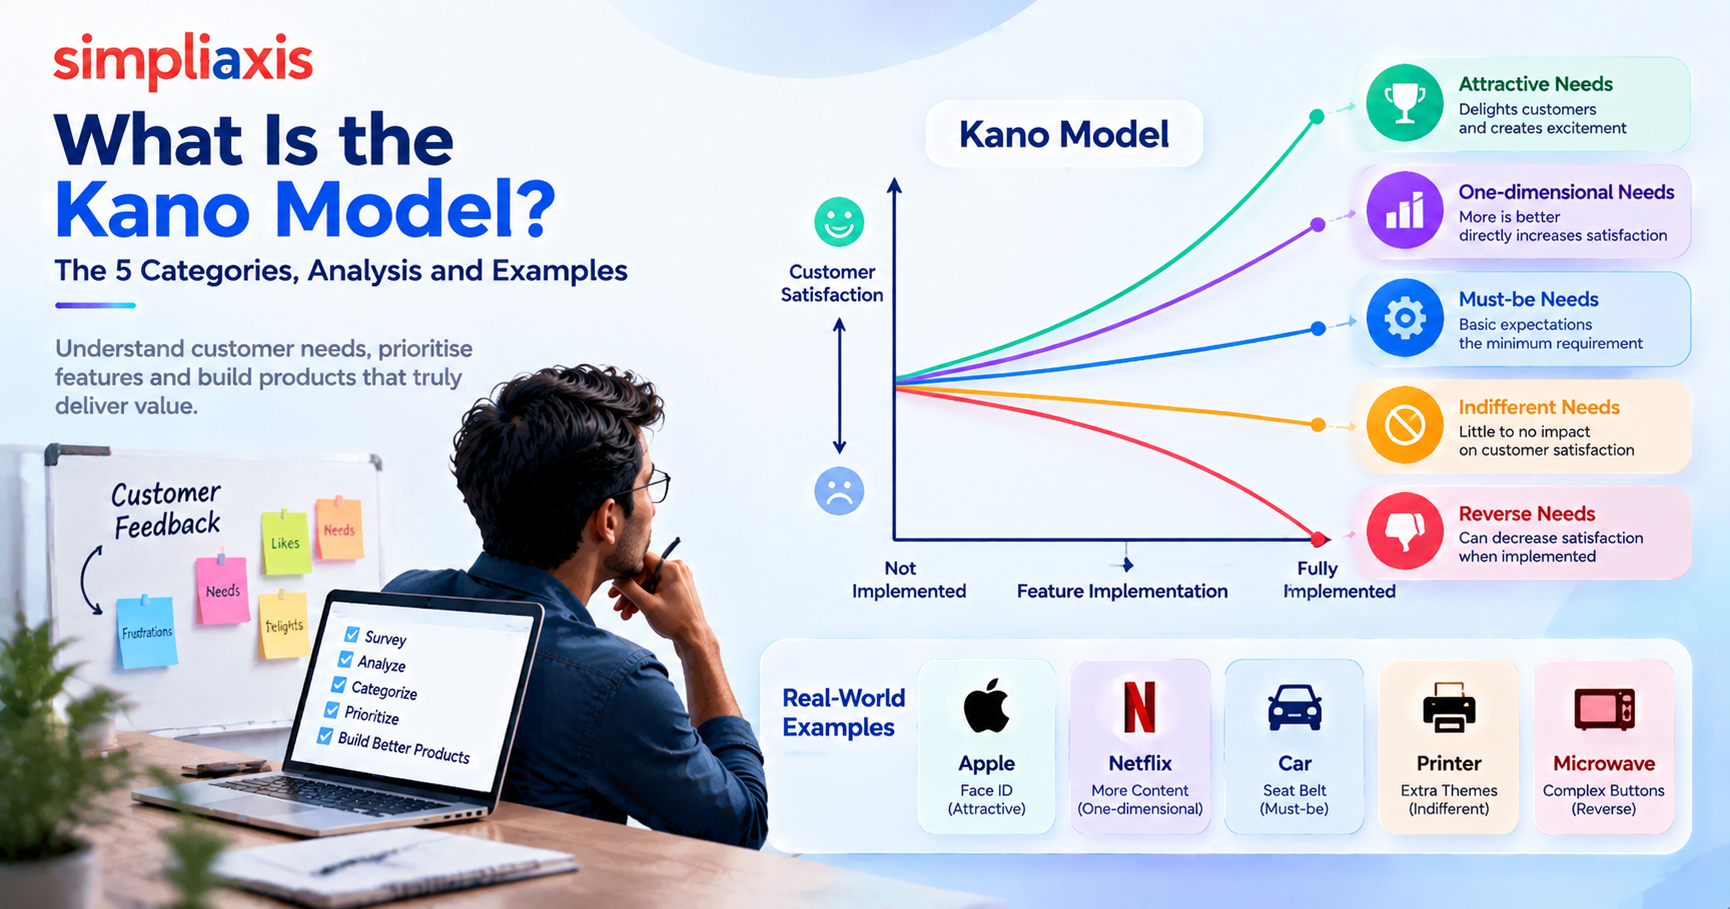
The Kano model is a customer satisfaction framework that sorts product features by how they affect user happiness. It groups needs into five categories: Must-Be, Performance, Attractive, Indifferent and Reverse. You classify each feature with a two-question survey, then use the results to decide what to build first, what to improve and what to skip.
Key Highlights: What Is the Kano Model?
- The Kano model, created in 1984 by Dr. Noriaki Kano, maps customer satisfaction against how well a feature is implemented. It helps teams decide what to build instead of relying on request counts.
- Features fall into five categories: Must-Be, Performance, Attractive, Indifferent and Reverse. Each one affects satisfaction differently, from preventing frustration to creating delight or having no effect at all.
- Needs change over time. Today's delighters become tomorrow's basics as competitors copy them, so teams should repeat the survey regularly.
- A Kano analysis pairs a functional and a dysfunctional question for each feature. Answers are classified with the evaluation table, then read through the full distribution and the Better and Worse coefficients.
- Backlog order follows the categories. Secure Must-Bes first, invest in Performance features, add a few Delighters, defer Indifferent items and redesign Reverse ones.
- The framework ignores effort. Pair it with MoSCoW, RICE, WSJF or a value vs effort matrix, and feed the results into the product backlog and roadmap for Agile and SAFe teams.
Introduction
Every product team faces the same problem. The backlog is full, the budget is limited, and every stakeholder believes their request is the most important one. Teams often fall back on volume. The feature requested most often wins.
That approach feels logical, but it misleads. A feature that customers expect without saying so will rarely show up in request lists. A feature that could delight them cannot be requested, because they have never imagined it. Counting requests tells you what people say, not how a feature changes their satisfaction.
This is where the Kano model helps. It looks at a feature from two angles: how users feel when it is present and how they feel when it is missing. That small shift reveals why some features keep customers loyal, why others only prevent complaints, and why a few have no effect at all.
In this guide, you will learn the definition, the five categories, the survey method, the evaluation table, a worked example and the common mistakes. You will also see how the framework fits alongside other prioritization methods and Agile and SAFe practice. Product owners, product managers, business analysts and marketers can all use it to make clearer decisions.
What Is the Kano Model?
The Kano Model is a feature prioritization framework created in 1984 by Dr. Noriaki Kano that maps customer satisfaction against feature implementation to help product teams decide what to build.
The framework evaluates features along two distinct axes:
- Horizontal Axis (Functionality/Execution): Measures how well or completely a feature is implemented, ranging from absent/poor to fully realized.
- Vertical Axis (Satisfaction): Measures the customer's emotional response, ranging from completely dissatisfied at the bottom to delighted at the top.
Features experience natural decay over time. Driven by market competition and evolving standards, yesterday's delighters become today's performance features and tomorrow's basic expectations (e.g., touchscreens on smartphones were once delighters, then performance criteria, and are now basic baseline features).
Kano model definition
The framework is a method for understanding how product features affect customer satisfaction. It rests on one idea: satisfaction does not rise in a straight line as you add functionality. Some features raise satisfaction sharply. Others only prevent dissatisfaction. Some do neither.
Think of a hotel stay. Clean sheets will not impress anyone, but bad ones will ruin the visit. A free room upgrade will delight a guest, yet nobody complains when it does not happen. Both are "features", but they act on satisfaction in opposite ways.
The framework turns this observation into a repeatable process. You list candidate features, ask customers a structured pair of questions about each one, and classify the answers. The output tells you what kind of need each feature represents, so you can invest accordingly.
The Origin of the Model (Noriaki Kano)
Professor Noriaki Kano of the Tokyo University of Science developed the idea in the 1980s. He and his co-authors, Nobuhiko Seraku, Fumio Takahashi and Shin-ichi Tsuji, published the foundational paper in 1984. It appeared in the Journal of the Japanese Society for Quality Control under the title "Attractive Quality and Must-Be Quality".
The paper argued that quality should be viewed in two dimensions rather than one. The authors tested the theory with a questionnaire survey about a TV set and a table clock. They also showed how the theory could guide the planning of a new clock.
Western practitioners learned the method mostly through a 1993 issue of the Center for Quality Management Journal. That issue set out the evaluation table and the customer satisfaction coefficient that product teams still use today.
The Kano Diagram: Satisfaction vs Functionality
The Kano diagram is the visual heart of the framework. It has two axes. The horizontal axis shows functionality, or how well a feature is implemented, from absent to fully delivered. The vertical axis shows customer satisfaction, from frustrated to delighted.
Different needs trace different curves on this chart. One curve rises steadily, so more functionality always brings more satisfaction. One curve stays below the midline, because delivering the feature only removes frustration. A third curve stays above the midline, because the feature delights when present but costs nothing when missing.
The diagram makes the central lesson easy to see. Effort and satisfaction are not linked in the same way for every feature. Some investments pay off in delight, and others only protect the baseline.
The 5 Categories of Customer Needs
The five categories form the core of Kano analysis. Each one describes a different relationship between a feature and satisfaction. Knowing them well makes every later step easier.
1. Must-Be or Basic Needs
Must-Be needs are the basics. Customers take them for granted and rarely mention them. If they are missing, dissatisfaction is intense. If they work well, customers feel neutral.
A banking app must keep money safe. A car must have working brakes. A food delivery app must deliver the right order. Nobody praises these things, but everyone notices when they fail.
Over-investing here has limits. Polishing a Must-Be feature beyond a reasonable standard will not raise satisfaction. Treat these needs as the entry ticket to the market. Meet them reliably, then move on.
2. Performance or One-Dimensional Needs
Performance needs follow a simple rule. The better you deliver them, the happier customers become. The worse you deliver them, the unhappier they get.
Battery life, app speed, storage space and price are typical examples. Customers can name these needs, compare them across brands and measure them. A phone that lasts two days beats one that lasts one day, and users notice.
This is the battleground for direct competition. Customers judge you against rivals on these features, so each improvement has a visible effect. The question is how far to go, because returns eventually shrink while costs keep climbing.
3. Attractive Needs or Delighters
Attractive needs are unexpected pleasures. Customers do not ask for them and would not miss them if absent. When present, they create strong positive emotion.
Think of a hotel that leaves a handwritten welcome note, or an app that quietly fills in a form you were dreading. Users did not request these touches, yet they remember them and talk about them. This is why delighters drive word of mouth.
They also differentiate. Rivals can copy a Performance feature quickly, but a creative delighter can set your product apart for a while. Use them sparingly and only after the basics are solid. A delighter on top of a broken foundation feels like a distraction.
4. Indifferent Needs
Indifferent needs do not move satisfaction in either direction. Customers do not care whether the feature exists.
Teams often build these features because a stakeholder wanted them or because a competitor had them. A rarely used settings page and a complex permission tree in a simple product are common examples. Users ignore them, so the effort returns nothing.
Spotting Indifferent features is one of the quiet strengths of this method. Every Indifferent result is work you can safely leave off the roadmap. That saves time, budget and complexity.
5. Reverse Needs
Reverse needs are features that some customers actively dislike. Their presence lowers satisfaction, and their absence raises it.
Constant push notifications are a familiar case. A forced tutorial for experienced users is another. A feature that delights one group may annoy another, which is why segmenting your respondents matters.
If the survey shows a Reverse result, pause and investigate before building. Ask whether the wording confused respondents or whether a real segment dislikes the feature. Either answer is useful.
How Do Customers Change Over Time?
Kano categories are not permanent labels. They describe how customers feel today, in a specific market, at a specific moment. As expectations shift, the same feature can move from one category to another.
Why Today's Delighters Become Tomorrow's Basics?
When a delighter proves its value, competitors copy it. Customers get used to it. Gradually, they stop noticing it when it works and start complaining when it does not. Kano himself described this slide as quality obsolescence.
Consider the touchscreen on early smartphones, or Wi-Fi on a flight. Both started as surprises. Both are now baseline expectations. Learn Leanlearn's example too: electric windows in cars were once an exciting feature and are now a basic need.
For product teams, this has two practical consequences. First, a delighter gives you a temporary advantage, not a permanent one. Second, you should repeat your survey regularly. A Kano study is a photograph of a moment, so last year's results may no longer apply. Many teams revisit the survey each year, or whenever the market changes sharply.
How to Run a Kano Analysis?
A Kano analysis follows a clear path. You gather feature ideas, write paired questions, collect responses, score each answer and read the results. The steps below explain each stage.
The Functional and Dysfunctional Question Pair
Every feature gets two questions. The functional question asks how the customer would feel if the feature were present. The dysfunctional question asks how they would feel if it were absent.
Asking both is essential. A single question such as "How important is this feature?" cannot tell a Must-Be from a Delighter, because customers may rate both as important. Only the combination reveals the true nature of the need.
For example, for a "dark mode" feature, you would ask: "How would you feel if the app had a dark mode?" Then you would ask: "How would you feel if the app did not have a dark mode?" The pair of answers places the feature in a category.
Building the Kano Questionnaire
A good Kano questionnaire is short, clear and specific. Start by listing candidate features from interviews, support tickets, reviews and team ideas. Describe each feature in plain language that focuses on the benefit. Avoid jargon and brand names.
Both questions in each pair use the same five answer options. The classic wording is: I like it that way, It must be that way, I am neutral, I can live with it that way, and I dislike it that way. Many teams shorten this to: I like it, I expect it, I am neutral, I can tolerate it, and I dislike it.
A few practical rules help:
- Keep to one feature per question pair.
- Limit each sitting to about eight to ten features, because fatigue creates contradictory answers.
- Pre-test the survey with three to five real customers.
- Keep the wording identical across all features.
- Add an optional importance question if you need extra context.
Plan your sample too. Many practitioners suggest at least 30 respondents per segment as a minimum, and larger samples give steadier results. TheGitLab Handbook – Kano survey for feature prioritization is a real product team’s working guide to running the survey.
Scoring and the Kano Evaluation Table
Once responses arrive, you classify each respondent's answer pair using the Kano evaluation table. The table is a five by five grid. Rows show the functional answer, and columns show the dysfunctional answer. Each cell returns a letter code.
The codes are A for Attractive, O for One-dimensional, M for Must-Be, I for Indifferent, R for Reverse and Q for Questionable. A Questionable result means the answers contradict each other, such as liking a feature both present and absent.
| Functional \ Dysfunctional | Like | Expect | Neutral | Tolerate | Dislike |
| Like | Q | A | A | A | O |
| Expect | R | I | I | I | M |
| Neutral | R | I | I | I | M |
| Tolerate | R | I | I | I | M |
| Dislike | R | R | R | R | Q |
Here is how to read it. If a respondent says "I like it" to the functional question and "I am neutral" to the dysfunctional question, the cell returns A. That feature is a Delighter for that person. If they say "I am neutral" to the first and "I dislike it" to the second, the cell returns M, a Must-Be.
Reading the Results
After classifying every respondent, count the letters for each feature. The most frequent letter, called the mode, becomes the feature's category.
If two categories tie, a common rule is to favour the one that matters most for customer protection, in the order Must-Be, Performance, Attractive, then Indifferent.
Always look at the full distribution, not only the winner. A split such as 45 percent Attractive and 40 percent Performance tells a different story from a clear 80 percent win. When results are close, use the customer satisfaction coefficients.
The Better coefficient shows how much satisfaction rises when you provide a feature. It equals (A + O) divided by (A + O + M + I). The Worse coefficient shows how much dissatisfaction grows when you leave it out. It equals negative (O + M) divided by (A + O + M + I). Reverse and Questionable answers stay out of the denominator.
Plot Better against the absolute Worse value on a scatter chart. High Better and high Worse points to a Performance feature. High Better and low Worse points to a Delighter. Low Better and high Worse points to a Must-Be. Low on both means Indifferent.
High Questionable counts are a warning. If more than about ten percent of answers are Questionable, rewrite the question instead of blaming respondents.
How to Prioritize Your Backlog With the Kano Model?
Once features carry a category, the build order becomes much clearer. The general rule is simple. Secure the Must-Best first, invest in Performance features that differentiate you, add a few Delighters, and skip the rest.
Here is how that looks in practice forproduct backlog prioritization:
- Fix gaps in Must-Be features. These protect you from losing customers. A missing Must-Be makes everything else irrelevant.
- Choose Performance features wisely. Pick the ones that match your target segment and where you can win against rivals.
- Add a small number of Delighters. They build loyalty and word of mouth, but only after the basics are stable.
- Defer Indifferent features. Build them only when they are cheap or support a marketing story.
- Remove or redesign Reverse features. Investigate why people dislike them before shipping anything similar.
One important caution applies. The framework measures satisfaction impact, but it does not measure effort.
A Delighter that takes six months may lose to a Performance feature that takes two weeks. For that reason, many teams classify with Kano first and then score effort with another method. The next sections show how.
Kano Model Example (Walkthrough)
Let us walk through a simple Kano analysis example for a fictional food delivery app called QuickBite. The team has five candidate features and surveys 100 customers.
The features are live order tracking, accurate delivery time estimates, a loyalty points program, a surprise free dessert on birthdays, and a built-in recipe blog.
Each customer answers a functional and dysfunctional question for all five features. The team then classifies the answers with the evaluation table. The summary below shows the percentage of respondents in each category.
| Feature | A | O | M | I | Category |
| Accurate delivery time | 6% | 24% | 62% | 8% | Must-Be |
| Live order tracking | 12% | 58% | 20% | 10% | Performance |
| Loyalty points | 30% | 45% | 5% | 20% | Performance |
| Birthday dessert | 68% | 10% | 2% | 20% | Attractive |
| Recipe blog | 8% | 4% | 3% | 85% | Indifferent |
Now apply the Better and Worse coefficients to the loyalty points feature. Better is (30 + 45) divided by (30 + 45 + 5 + 20), which gives 0.75. Worse is negative (45 + 5) divided by 100, which gives negative 0.50. The feature raises satisfaction when present and hurts moderately when absent, so it is a solid Performance feature.
The decisions follow naturally. QuickBite fixes delivery time accuracy first, since it is a Must-Be and a failure there drives customers away. It then improves live tracking, a Performance feature with a clear competitive effect.
Loyalty points come next. The birthday dessert goes in as a low-cost Delighter that people will share on social media. The recipe blog is dropped, saving development time for features that matter.
Notice what the team avoided. Without the survey, the loud marketing voice might have pushed the recipe blog. The structured Kano analysis gave the team evidence to say no.
Within a few quarters, QuickBite should repeat the survey. Live tracking, once a Performance feature, may drift toward Must-Be as every competitor offers it. That is the lifecycle at work.
Kano Model vs Other Prioritization Frameworks
No single framework answers every question; Kano is one of severalagile prioritization techniques.Other methods focus on urgency, reach, cost or value. Knowing the differences helps you combine them well.
Kano vs MoSCoW
MoSCoW prioritization sorts requirements into Must have, Should have, Could have and Won't have. It works well for scope decisions, especially when a fixed deadline forces trade-offs. If you want a deeper explanation, read this guide on MoSCoW prioritization.
The key difference is the source of the label. In MoSCoW, stakeholders and the team decide what is a Must. In Kano, customers decide through their survey answers. MoSCoW is fast, but opinions can dominate. Kano is slower, but the evidence comes from users.
The two also fit together. Run a survey to learn what customers truly see as Must-Be, then use those results to support your MoSCoW labels. That removes much of the guesswork from the debate.
Kano vs RICE and WSJF
TheRICE prioritization frameworkscores each item on Reach, Impact, Confidence and Effort. The formula is Reach multiplied by Impact multiplied by Confidence, divided by Effort. It produces a ranked list that is easy to defend in meetings.
WSJF, or Weighted Shortest Job First, is common in SAFe. It divides the cost of delay by job size, so work that delivers value quickly rises to the top. Both methods are strong on economics and effort, which is exactly where Kano is weak.
Kano adds something these scoring models lack. RICE asks you to estimate Impact, but it does not tell you what kind of impact a feature has. A Kano result tells you whether a feature protects the baseline, raises satisfaction steadily or creates delight. You can use that insight to make your Impact score more honest.
Avalue vs effort matrixis another popular tool. It plots features on a grid of customer value against delivery effort, and it supports quick, visual feature prioritization. Kano can feed the value axis with real customer data, instead of guesses.
When to Use Which?
Each method answers a different question. The table below gives a quick comparison.
| Method | Best for | Main strength | Main limit |
| Kano | Understanding customer needs | Reveals the type of satisfaction impact | Ignores effort and cost |
| MoSCoW | Scope decisions under a deadline | Fast and simple | Relies on opinion |
| RICE | Ranking many items by score | Balances reach, impact and effort | Scores can hide guesswork |
| WSJF | Economic sequencing in SAFe | Considers cost of delay | Needs good estimates |
| Value vs effort matrix | Quick visual triage | Easy to explain | Value is often subjective |
A practical sequence is to use Kano to classify features, then apply RICE or WSJF to rank them, and finally use MoSCoW to lock the scope of a release. That way, customer evidence, economics and delivery constraints all shape the plan.
Using the Kano Model in Agile and SAFe Teams
Agile teams value fast feedback and customer focus. The framework fits both ideas. It gives product owners structured customer input before sprints begin, and it keeps teams from building features nobody wants.
Customer Centricity and Feature Prioritization
Customer centricity means decisions start with the user. In Kano terms, that means asking how each feature affects satisfaction before you commit capacity to it. The survey converts vague opinions into data a team can discuss calmly.
Product owners and product managers benefit most. The method gives them a neutral way to push back on stakeholders. Instead of saying "I don't think we need that", they can say "Eighty-five percent of customers are indifferent to it".
In SAFe environments, this skill is part of a wider role. The Product Owner and Product Manager must balance customer value, business goals and team capacity. To see how those duties are defined, read aboutSAFe POPM roles and responsibilities.
If you are weighing the credential itself, this overview explainswhat the SAFe POPM certification covers.
Feeding Kano Insights Into the Product Backlog and Roadmap
Kano results work best as strategic input, not as a sprint ticket generator. A good approach is to run a survey once per quarter or per major release cycle. Then you carry the findings into planning in three steps.
First, tag each backlog item with its Kano category. A simple label such as Must-Be, Performance or Delighter is enough. Second, use the tags to balance each iteration, so every release includes some protection, some improvement and a little delight. Third, update the tags after each new survey.
The same tags help at the roadmap level. A healthyproduct roadmaprarely contains only Delighters or only Must-Bes. It shows a deliberate mix, with early themes focused on basics and later themes aimed at differentiation. When a stakeholder asks why a flashy idea is not on the next release, the category gives a clear answer.
Remember that classification does not explain why customers feel as they do. Follow up with a few interviews on features with split results. Numbers show what happened, and conversations explain it.
Kano Model Templates and Tools
You do not need to build everything from scratch. Plenty of templates and tools can speed up the work. Choose based on how many features and respondents you have.
A typical Kano model template includes five parts:
- Paired functional and dysfunctional questions for each feature.
- A standard five-point answer scale.
- The evaluation table for classifying each answer pair.
- A response coder that tallies results per feature.
- A prioritization view that ranks features by category.
Spreadsheets handle small studies well. Add one row per respondent and one column per question, then use a lookup formula that references the evaluation table. Tally the letters with COUNTIF and calculate the Better and Worse values with simple formulas.
Dedicated tools save time on larger projects. Some survey platforms support the paired-question layout and export respondent data for scoring. Others, such as Kano-specific tools, classify answers and chart the results automatically. Check carefully what each tool does. Some handle only the survey stage, while classification and charting remain manual work in Excel, R or Python.
Whatever you choose, keep three habits. Use one consistent wording for the whole study, document your evaluation table source, and store raw responses so you can re-score later.
Common Mistakes When Using the Kano Model
Even a well-designed study can mislead if the method is applied carelessly. These are the mistakes that appear most often.
- Asking only one question. Without the dysfunctional question, the asymmetry stays hidden and categories blur together.
- Using technical wording. Respondents need to understand the feature in plain language. Confusing descriptions create Questionable answers.
- Testing too many features at once. Long surveys cause fatigue and contradictory responses. Keep each sitting short.
- Treating answers as a rating scale. The five options are categories, not scores from one to five. Do not average them.
- Ignoring segments. A feature may delight power users and bore beginners. Mixed results can cancel out in the overall figure.
- Showing only the winning category. Always report the full distribution, especially when results are close.
- Trusting a swapped table. Using the wrong evaluation grid will quietly misclassify features.
- Treating results as permanent. Delighters decay, so repeat the survey regularly.
- Skipping effort analysis. Kano measures satisfaction impact, not cost. Combine it with effort-based methods before you commit.
- Using it for live production health. For features already shipped, measure satisfaction with CSAT or usability testing instead.
Avoid these traps and your results will be far more reliable.
Conclusion
The Kano model gives product teams a practical way to see beyond request counts. By sorting features into Must-Be, Performance, Attractive, Indifferent and Reverse needs, it shows where effort protects customers, where it earns loyalty and where it is wasted. Combined with MoSCoW, RICE, WSJF or a value vs effort matrix, it supports confident, evidence-based roadmap decisions.
Strong frameworks only help when you apply them well. If you want to build these skills for real Agile and SAFe environments, structured training can speed up your growth.
TheSAFe POPM Certification Trainingfrom Simpliaxis teaches you to prioritize backlogs, align teams with customer value and lead product delivery at scale. Explore the course, take the next step in your product career and turn customer insight into products people love.








 Lowest-Price Challenge












 Personalized Path



.webp)


 USA
 Canada
 India
 UK
 Australia
 Singapore


