


 Call Us



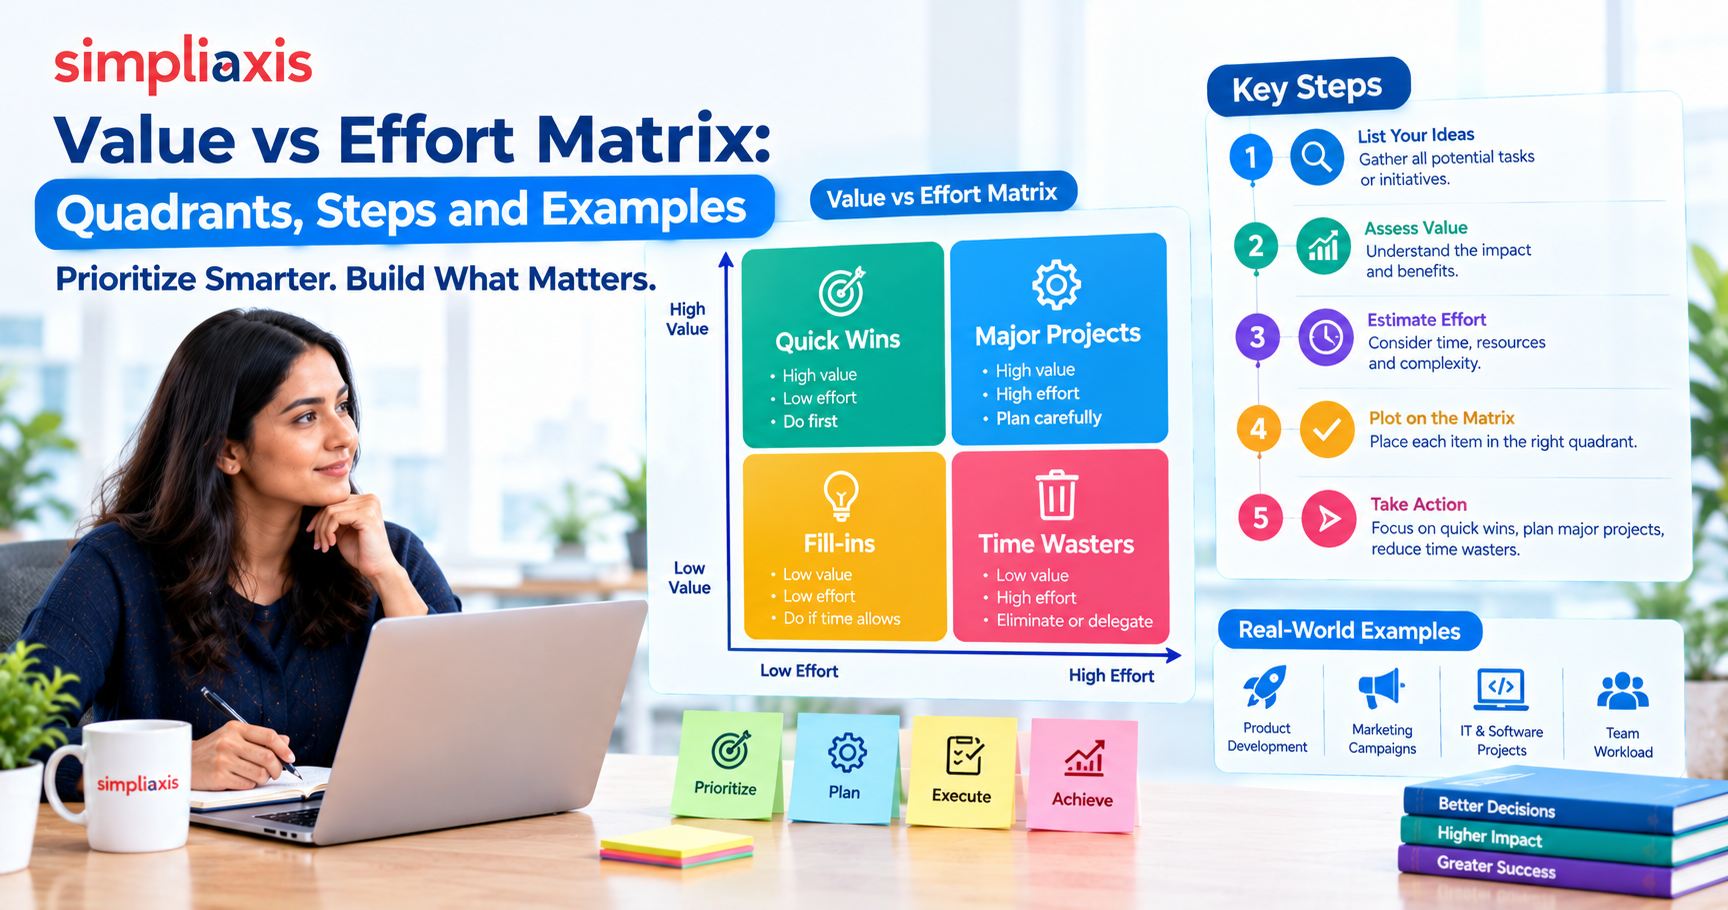
The value vs effort matrix is a 2x2 prioritization grid that plots each feature or initiative by the value it delivers against the effort that is required. Its four quadrants are-
Quick wins (high value, low effort),
Big bets (high value, high effort),
Fill-ins (low value, low effort), and
Time sinks (low value, high effort).
Teams do quick wins first, plan big bets, schedule fill-ins around gaps, and drop time sinks.
Key Highlights of Value vs Effort Matrix
- Value vs. effort turns a long, argued-over list into a visual map in about one workshop.
- Each quadrant implies a clear action: do, plan, fill, or drop.
- Value and effort should be scored separately, by different people.
- The same grid appears as impact vs effort, benefit vs effort, and the PICK chart.
- It works best as a first filter for early-stage prioritization, with fewer than about 30 items.
- It cannot show dependencies, so sequencing needs a second step.
Introduction
To understand the value vs effort matrix, let us take a look at a hypothetical example. A product team has 40 ideas and capacity for six. Sales wants one feature, engineering wants a refactor, and support wants a dozen small fixes. Everyone's request sounds reasonable, and nobody can say which ones to drop. Under these circumstances, the value vs effort matrix gives that conversation a structure. Instead of debating each idea in isolation, the team places every item on one grid and sees at a glance which work pays off quickly and which work drains time.
This guide explains the matrix, its four quadrants, how to score both axes, and how to build one step by step. It also covers a worked example, common pitfalls, comparisons with RICE and MoSCoW, and how the matrix fits into SAFe and agile teams. Teams that already practice feature prioritizationwill find it a useful first-pass filter.
What Is the Value vs Effort Matrix?
The value vs effort matrix is a two-dimensional prioritization tool that plots initiatives by expected value and required effort. It sorts them into four quadrants, each with a different recommended action. Teams use it to decide what to do first when they cannot do everything.
Definition and the Two Axes
The vertical axis shows value: The benefit an item should deliver.
The horizontal axis shows effort: The cost of delivering it. Every candidate becomes one point on the grid.
The matrix works because it asks for relative judgments, not exact numbers. Nobody can say a feature is worth precisely 7 out of 10. However, a team can usually agree that it is worth more than another item and costs less to build.
Value vs Complexity and Impact vs Effort (the Same Idea)
You will find this grid under several names. Impact vs effort, benefit vs effort, the action priority matrix, and the PICK chart all use the same structure, with only the labels changed. The PICK chart comes from Lean Six Sigmaand is commonly attributed to Lockheed Martin.
Two label choices matter in practice. "Impact" pushes teams toward measurable change, so it often forces a clearer definition than "value". "Complexity" replaces "effort" when risk matters more than hours, because a short task can still be treacherous.
Where It Fits Alongside the Roadmap and Backlog
The matrix sits between the idea list and the roadmap. It sorts raw candidates, but it does not schedule them.
In practice, a team plots its backlog candidates, chooses what to pursue, and then sequences the chosen items on the roadmap. Think of it as a filter, not a plan.
The 4 Quadrants of the Value vs Effort Matrix
Each quadrant of the value-effort matrix is a decision, not just a label. The table below summarizes them before we look at each in turn.
| Quadrant | Value | Effort | Default action |
| Quick wins | High | Low | Immediate action required |
| Big bets | High | High | Plan and sequence |
| Fill-ins | Low | Low | Do when there is slack |
| Time sinks | Low | High | Drop or defer |
Quick Wins: High Value, Low Effort
Quick wins sit in the top-left corner. They deliver meaningful benefits for little work, so they go first. For instance, a CSV export button, a saved-filter feature, or a clearer error message. Early wins also build credibility with stakeholders. However, if the exercise produces none, the easy value has probably been taken already.
Big Bets: High Value, High Effort
Big bets offer substantial returns but need real investment. Think of a permissions overhaul, a mobile app, or a platform migration. Take on one or two at a time. These items need a proper business case and a sequenced plan, not a sticky note.
Fill-ins: Low Value, Low Effort
Fill-ins are cheap and minor. Theme colors or small cosmetic tweaks usually land here. Do them when the team has spare capacity, or someone is blocked on other work. Cheapness alone is not a reason to let them displace a big bet.
Time Sinks: Low Value, High Effort
Time sinks cost a lot and return little. The strongest use of the matrix is often finding what to cut, and this bottom-right quadrant is where that happens. Drop these items visibly and tell whoever requested them. If the quadrant is empty after a session, the team probably ratified its existing plan instead of making decisions.
How to Score Value and Effort?
Good scoring separates a useful matrix from a diagram of someone's opinion. Both axes need clear definitions before anyone places a dot.
What to Include in Value?
Define value in one sentence for the decision at hand. Common components include:
- Revenue or cost savings
- Customer retention or satisfaction
- Number of users affected
- Strategic alignment
- Risk reduction
Teams working in SAFe can borrow ideas from Scaled Agile Framework Business Value when defining what value means across a larger portfolio. Ask value to whom before scoring, because each person may otherwise hold a private definition.
What to Include in Effort
Effort covers the whole cost of delivery, not just coding time. Include:
- Design, development, and testing
- Dependencies on other teams
- Technical debt the work must pay down
- Ongoing maintenance and support
- Uncertainty and risk
Effort is the weaker axis. Software effort estimates carry a long-documented optimism bias, and a 2x2 grid shows no error bars. Let the people who will do the work score it. If your team already estimates with T-shirt sizes, those map neatly onto the effort axis.
Using a Consistent 1 to 10 Scale
Use the same 1 to 10 range on both axes, and agree on anchors beforehand. For example, one team might use these effort anchors:
| Score | Effort anchor (example) |
| 1 to 2 | A few days or less |
| 3 to 4 | Within one sprint |
| 5 to 6 | One to two sprints |
| 7 to 8 | A quarter-sized project |
| 9 to 10 | Multiple quarters, multiple teams |
Then set a threshold. In this guide, a score of 6 or higher counts as "high" on either axis. Without anchors, a 7 means something different to every person.
How to Build a Value vs Effort Matrix Step by Step?
Learning how to use a value vs effort matrix takes about ninety minutes for twenty candidates. Follow these four steps.
Step 1: List Candidate Features or Initiatives
Gather every candidate in one place. Write each on a card or a spreadsheet row with a short, clear name. Following that, remove duplicates and vague items first. "Improve search" is too fuzzy to score, so rewrite it before it enters the room.
Step 2: Score Each on Value and Effort
Score the two axes separately. The outcome owner rates value, while the delivery team rates effort, and neither sees the other's numbers first. This matters because the first voice in a joint session anchors both scores at once. Separate scoring lets the estimates disagree, and the disagreement is where the useful information sits.
Step 3: Plot Them on the 2x2 Grid
Draw a square with value on the vertical axis and effort on the horizontal axis. Mark the midpoint on each. Place each item at its score coordinates.
Use a whiteboard, sticky notes, or a spreadsheet scatter chart. Teams looking for a value vs. effort matrix template can build one in a spreadsheet with these columns: item, owner, value score, effort score, evidence, quadrant, and decision.
Step 4: Prioritize by Quadrant and Sequence the Roadmap
Act on each quadrant in order:
- Schedule quick wins immediately.
- Choose one or two big bets and sequence them.
- Hold fill-ins for spare capacity.
- Drop or defer time sinks, and record why.
Then check dependencies, because the grid cannot show them. A fill-in might block a big bet, and only a separate sequencing pass will reveal that.
Value vs Effort Matrix Example (Worked)
Here is a hypothetical example for a project management SaaS product. The team scores ten candidates and uses 6 or above as the "high" threshold.
| Candidate | Value | Effort | Quadrant |
| CSV export | 7 | 2 | Quick win |
| Saved dashboard filters | 8 | 3 | Quick win |
| Slack notifications | 6 | 4 | Quick win |
| Role-based permissions | 9 | 8 | Big bet |
| Mobile app | 8 | 9 | Big bet |
| Public API | 7 | 7 | Big bet |
| Custom theme colors | 3 | 2 | Fill-in |
| Emoji reactions on comments | 2 | 3 | Fill-in |
| Built-in video chat | 3 | 9 | Time sink |
| Custom report designer | 4 | 8 | Time sink |
What the team decides. The three quick wins go into the next sprint. Role-based permissions become the quarter's single big bet because several enterprise deals depend on it. The mobile app and public API wait.
The fill-ins sit in the backlog for slack days. The team drops video chat, since integrations with existing video tools cover the need, and it declines the report designer in favor of the export feature.
What the grid misses. The public API needs the permissions model first, but the matrix cannot show that. The team catches the dependency only during sequencing. That is why the matrix chooses what to do, while a second step decides the order.
Advantages of the Value vs Effort Matrix
Fast, Visual, and Easy for Stakeholders
Two axes and four boxes need almost no explanation. Non-technical stakeholders can read the grid within seconds, and they can argue by moving a sticky note instead of editing a formula.
Ideal for Workshops and Early-Stage Prioritization
The matrix needs no historical data and no tooling. That makes it a good fit for early-stage products, quarterly planning sessions, and cross-functional workshops where people will not engage with a scoring model.
Builds Quick-Win Momentum
Finishing small, visible improvements early shows progress. As a result, teams gain credibility and stakeholder patience for the larger projects that follow.
Beyond these benefits, the matrix also exposes expensive, unwanted work. Few other lightweight methods do that as directly.
Pitfalls and Limitations to Watch For
Oversimplifying Complex Trade-offs
Two axes cannot capture everything. Risk, urgency, dependencies, and strategic fit all fall outside the grid. Treat the output as a conversation starter, not a verdict.
Effort Estimates That Hide Dependencies and Tech Debt
An item plotted at low effort carries no confidence marker. A customer-facing API may look cheap because the endpoints exist, yet it may still need rate limiting, authentication, and versioning. Ask the delivery team to list dependencies and debt before they score.
Value Scored on Opinion Rather Than Evidence
Value estimates often reflect the loudest voice. Back each value score with at least one piece of evidence, such as customer requests, usage data, or revenue at risk. Otherwise, the matrix simply formalizes an existing preference.
Everything Landing in the High-Value Quadrant
This happens when the people who propose items also score them. Two fixes help. First, rank all items against each other on value before plotting. Second, let a different group own each axis. If the time sink quadrant is empty, nothing was truly deprioritized.
Value vs Effort Matrix vs Other Frameworks
Many Agile Prioritization Techniques exist, and each answers a slightly different question. The matrix is the lightest of them, so it often serves as a first step.
Value vs Effort vs RICE
The RICE Prioritization Framework scores reach, impact, confidence, and effort. Its formula, reach times impact times confidence divided by effort, produces a single ranked list.
The matrix is faster and needs no data. RICE is more defensible because every row carries a number. In short, use the matrix for speed and RICE when you must justify the ranking to leadership.
Value vs Effort vs MoSCoW
MoSCoW Prioritization sorts requirements into must have, should have, could have, and won't have. It manages scope against a fixed deadline and ignores cost.
The matrix, in contrast, focuses on cost versus benefit. Choose MoSCoW when the question is what ships by a set date. Choose the matrix when effort varies widely between options.
When to Graduate to a Weighted or WSJF Model
Move beyond the grid when you need defensible ranking, sequencing, or comparison across many items. Weighted Shortest Job First divides Cost of Delay by job size, and Cost of Delay combines user-business value, time criticality, and risk reduction or opportunity enablement.
That model adds the time dimension the matrix lacks. A common path is to plot everything on the matrix first, then run RICE or WSJF on the top candidates only. For a side-by-side view of two common follow-up methods, see WSJF vs MoSCoW.
Using Value vs Effort in SAFe and Agile Teams
In Scrum and agile teams, the matrix supports backlog refinement. Product Owners can use it before sprint planning to separate quick wins from items needing more discussion. Certified Scrum Product Owner (CSPO) training covers this kind of team-level backlog prioritization. Because the estimates are relative, story points work well for the effort axis. Techniques such as Planning Pokerhelp teams agree on those effort scores.
SAFe applies similar logic at scale. SAFe uses WSJFto sequence features, capabilities, and epics, and it estimates its components with relative sizing on a modified Fibonacci scale. The matrix fits earlier and lower in that flow: team-level ideation, pre-PI preparation, and workshops where a quick visual helps more than a scoring model.
Practitioners who want to apply these methods across a Release Train can build the skills through SAFe POPM Certification Training, which covers prioritization at team and program level.
Best Practices for the Value vs Effort Matrix
- Define value first: Write one sentence stating what value means for this decision.
- Split the scoring: Let the outcome owner score value and the delivery team score effort.
- Use evidence: Attach data or customer input to every high value score.
- Cap the list: Stay under about 30 items so the plot remains readable.
- Name an owner: Decide who can overrule the matrix, and require them to do it openly.
- Limit fill-ins: Cap the share of capacity they may take, so they never displace big bets.
- Record decisions: Note what you dropped and why, then tell the requesters.
- Revisit regularly: Re-plot each quarter, because effort and value both change.
Tools and Templates
You do not need special software. A whiteboard and sticky notes work for a room, and a spreadsheet scatter chart works for a remote team.
Common options include:
- Online whiteboards such as Miro, Mural, and FigJam, which offer ready-made impact vs. effort templates
- Spreadsheets, using a scatter chart with value on the vertical axis and effort on the horizontal axis
- Product management platforms such as Productboard, Aha! and Airfocus, which include built-in prioritization views
- Planning tools such as Jira or Trello, using custom fields for value and effort scores
For broader quality and planning resources, the ASQ quality tools library and PMI's insights hub offer general background on prioritization and process improvement. Whatever the tool, keep a record of the scores and rationale next to the chart.
Conclusion
The value vs effort matrix gives teams a fast, visual way to turn a crowded backlog into clear decisions. Its biggest strength is exposing the expensive, low-value work that nobody wants to cut.
The practical takeaways are straightforward. Define value before scoring, split the two estimates between different people, and back every score with evidence. Then act on the quadrants: do the quick wins, plan one or two big bets, and drop the time sinks. Finally, sequence the chosen work separately, because the grid cannot show dependencies.
When you outgrow the matrix, RICE, MoSCoW, or WSJF can add the rigor it lacks. Product Owners and Product Managers who want structured practice with these methods can explore Simpliaxis' SAFe training to see them applied at program scale.







 Lowest-Price Challenge











 Personalized Path


.webp)


 USA
USA  Canada
 India
India UK
UK Australia
 Singapore


