


 Call Us



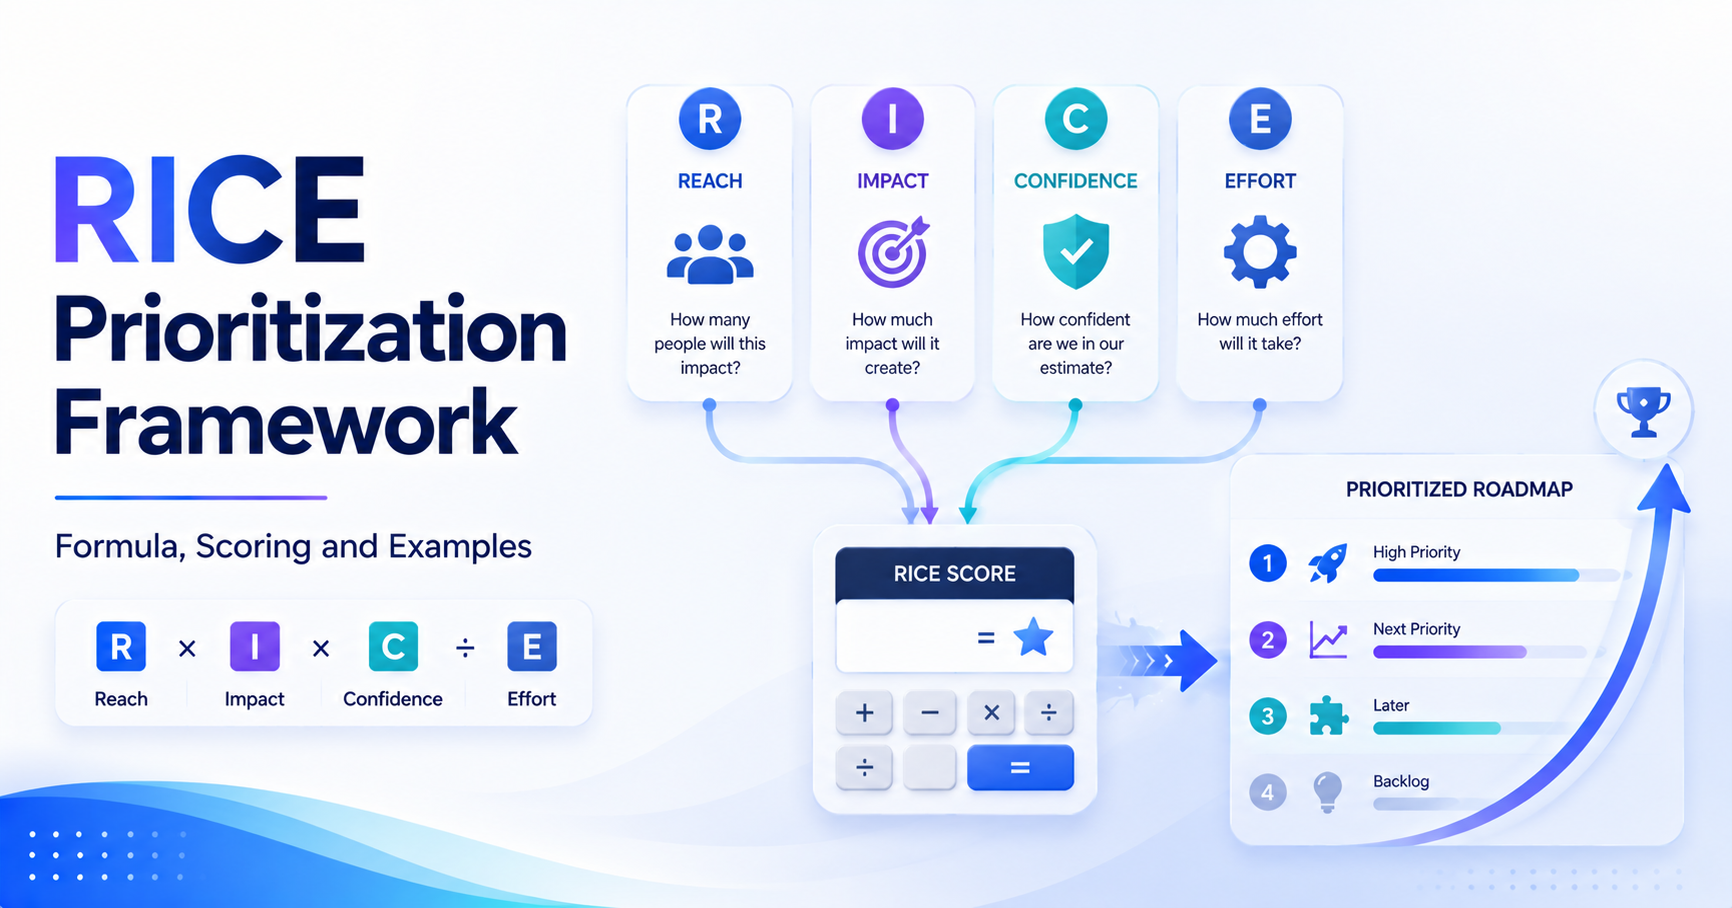
The RICE prioritization framework is a product-management scoring method used to compare initiatives using four factors: Reach, Impact, Confidence, and Effort. Its core formula is:
RICE Score = (Reach × Impact × Confidence) ÷ Effort
Reach estimates how many users or events an initiative affects during a defined period. Impact estimates the size of that effect, Confidence reflects how reliable the estimates are, and Effort measures the work required, commonly in person-months. The resulting RICE score gives teams a consistent way to compare opportunities that otherwise may be difficult to evaluate side by side.
Key Highlights of RICE Prioritization Framework
- RICE stands for Reach, Impact, Confidence, and Effort.
- The RICE score formula is (Reach × Impact × Confidence) ÷ Effort.
- Reach should always use a defined time period, such as customers per month or transactions per quarter.
- Impact is commonly scored as 3, 2, 1, 0.5, or 0.25.
- Confidence is expressed as a percentage, commonly 100%, 80%, or 50% in the original model.
- Effort is commonly estimated in person-months.
- A higher RICE score indicates greater estimated impact relative to the effort required, but it should not be treated as an automatic decision.
- RICE works particularly well when teams need to compare many product or feature ideas using the same criteria.
- Dependencies, regulatory requirements, strategic commitments, deadlines, and other constraints should be considered alongside the score.
Introduction
Product teams rarely suffer from a shortage of ideas. The harder problem is deciding which idea deserves attention first.
A product backlogcan contain customer requests, usability improvements, growth experiments, technical upgrades, compliance work, new features, and strategic initiatives. Several of them may sound important at the same time. Without a consistent prioritization method, discussions can easily become dominated by whoever has the strongest opinion, the loudest stakeholder, or the most persuasive anecdote. This is where a structured approach, such as the RICE prioritization framework, can be useful.
RICE converts four different considerations- how many people are affected, how much they might benefit, how certain the estimates are and how much work is involved – into a common score. In Intercom’s original explanation, RICE is described as a way to consistently combine these factors, instead of trying to make every prioritization decision based solely on intuition. This guide explains the RICE scoring framework, the formula behind it, how to calculate a score, a detailed RICE prioritization example, a practical template, its advantages and limitations, and how it compares with MoSCoW, a value vs effort matrix, and WSJF in SAFe.
What Is the RICE Prioritization Framework?
The RICE prioritization framework is a quantitative method for ranking product initiatives according to four dimensions: Reach, Impact, Confidence, and Effort.
Rather than asking only, "Which feature is most valuable?", RICE encourages teams to ask four related questions:
- Reach: How many people or events will this affect?
- Impact: How significant will the effect be?
- Confidence: How certain are we about those estimates?
- Effort: How much work will it take?
The four values are combined into one score. The approach is especially useful for feature prioritization, roadmap planning, experimentation, and backlog refinement.
RICE Definition and the Four Factors
Reach represents the number of users, customers, transactions, or other relevant events affected within a specified time period.
Impact represents the estimated effect on each affected user or event. The original Intercom model uses a 3-to-0.25 scale.
Confidence acts as a correction factor. A promising initiative supported by strong evidence can receive a higher confidence value than an initiative based mainly on assumptions.
Effort represents the total amount of work required from the relevant team members. The original model recommends person-months and deliberately keeps estimates relatively rough.
Together, these factors balance potential upside against uncertainty and required investment.
How RICE Turns Debate Into a Comparable Score?
Consider two proposals:
- Feature A could affect 10,000 users but requires six person-months.
- Feature B could affect 2,000 users but requires only one person-month.
Simply choosing the feature with greater reach could favor A. Choosing the lowest effort could favor B.
RICE considers both.
This does not eliminate judgment. Instead, it moves some of the judgment into explicit assumptions that stakeholders can challenge. A discussion can shift from "I think this feature is more important" to "Why did we estimate reach at 10,000, and what evidence supports an impact score of 2?"
That makes the decision process easier to inspect and revise.
When RICE Beats MoSCoW or a Value vs Effort Matrix
RICE is particularly useful when a team has many initiatives that all appear important and needs more differentiation than broad categories such as high, medium, and low.
MoSCoW prioritization, for example, classifies work as Must Have, Should Have, Could Have, or Won't Have this time. It is useful for clarifying what is essential within a defined timeframe, but it does not produce a numerical comparison between individual items.
A value vs effort matrix is similarly useful for visualizing opportunities, but it typically evaluates two dimensions rather than four.
For a broader overview, see these guides on Agile Prioritization Techniques and Feature Prioritization.
The RICE Score Formula Explained
The Formula: (Reach x Impact x Confidence) / Effort
The standard RICE formula is:
RICE Score = (Reach × Impact × Confidence) ÷ Effort
Suppose an initiative has:
- Reach = 4,000 users
- Impact = 2
- Confidence = 80% or 0.8
- Effort = 4 person-months
The calculation is:
(4,000 × 2 × 0.8) ÷ 4 = 1,600
The resulting RICE score is 1,600.
The absolute number is less important than how it compares with scores calculated using the same assumptions and units.
Why Effort Sits in the Denominator
Reach, Impact, and Confidence contribute positively to the score. Effort works in the opposite direction.
If two initiatives have similar potential impact but one requires twice as much work, the greater effort should reduce its relative priority.
For example:
- Initiative A: (5,000 × 2 × 0.8) ÷ 2 = 4,000
- Initiative B: (5,000 × 2 × 0.8) ÷ 4 = 2,000
The potential benefit assumptions are identical, but Initiative A requires half the effort. Its RICE score is therefore twice as high.
This is one reason RICE is often described as measuring estimated impact relative to the time or work required.
How to Read Relative RICE Scores
RICE scores are best interpreted relative to one another.
If four initiatives score 2,000, 1,500, 900, and 400, the scores establish an ordering under the assumptions used. They do not mean that the first initiative is objectively five times as valuable as the fourth.
A score of 2,000 is also not "good" in isolation. There is no universal threshold at which a RICE score becomes worthwhile.
Teams should therefore avoid creating arbitrary rules such as "anything above 1,000 must be built." The score is a decision-support input, not a substitute for product judgment.
Breaking Down the Four RICE Factors
Reach: Users or Events in a Time Window
Reach answers a deceptively simple question: How many people or events will this initiative affect during a defined period?
The time window matters. A team might measure:
- Customers per month
- Users per quarter
- Transactions per week
- Accounts per release
- Orders per year
For example, if 8,000 customers enter a workflow each quarter and 25% are expected to use a new capability, estimated reach is:
8,000 × 25% = 2,000 customers per quarter
The original RICE model emphasizes using real product measurements where possible rather than inventing numbers without evidence.
Impact: The 3, 2, 1, 0.5, 0.25 Scale
Impact is usually the most subjective RICE factor because product teams cannot always predict behavior precisely.
The original RICE model uses:
Impact | Meaning |
3 | Massive |
2 | High |
1 | Medium |
0.5 | Low |
0.25 | Minimal |
For example, an initiative expected to materially improve a core conversion funnel might receive a 2, while a minor interface improvement might receive 0.5.
The important point is consistency. Teams should define what each level means for their particular objective instead of changing the interpretation from feature to feature.
Confidence: Discounting Guesswork With a Percentage
Confidence reduces the influence of estimates that are not strongly supported by evidence.
The original RICE approach uses:
- 100% = high confidence
- 80% = medium confidence
- 50% = low confidence
These values are converted into decimals when calculating the score.
For example, suppose a team predicts a major conversion improvement but has only a handful of customer interviews supporting the assumption. Assigning 50% confidence prevents the optimistic impact estimate from dominating the calculation.
Confidence is particularly useful for distinguishing between:
"We have evidence this works."
and
"We believe this could work."
Effort: Estimating Work in Person-Months
Effort represents the total work required from the people involved in delivering the initiative.
The original RICE model uses person-months, combining work across product, design, engineering, and other relevant contributors. It also recommends keeping estimates relatively rough rather than creating a false impression of accuracy.
For example, an initiative requiring:
- 0.5 person-month of product work
- 0.5 person-month of design
- 2 person-months of engineering
could be represented as approximately 3 person-months of effort.
The exact estimation convention should be agreed across the team. Mixing person-months for one initiative with engineering hours for another will make the resulting scores difficult to compare.
How to Calculate a RICE Score Step by Step?
Step 1: List the Initiatives to Compare
Start with a manageable set of initiatives that compete for the same capacity.
For example:
"We believe this could work."
Effort: Estimating Work in Person-Months
For example, an initiative requiring:
- 0.5 person-month of product work
- 0.5 person-month of design
- 2 person-months of engineering
- Simplify onboarding
- Add CSV exports
- Improve mobile search
- Build an advanced reporting dashboard
Avoid scoring hundreds of vague backlog items at once. RICE works best when the items are sufficiently defined to estimate their likely reach, impact, confidence, and effort.
Step 2: Agree the Time Window and Units for Reach
Choose one consistent period.
For example:
Reach = customers affected per quarter
Then use that definition across the initiatives being compared.
Also agree whether effort means person-months, person-weeks, or another unit. Consistency matters more than selecting a universally perfect unit.
Step 3: Score Impact, Confidence, and Effort
Use the team's agreed scales.
For Impact, the original RICE scoring framework provides five choices: 3, 2, 1, 0.5, and 0.25.
For Confidence, use percentages such as 100%, 80%, or 50%.
For Effort, estimate the total person-months required.
Document the reasoning behind unusual scores. If an initiative receives an impact score of 3, the team should be able to explain what evidence supports that assessment.
Step 4: Apply the Formula and Rank the Results
Calculate:
(Reach × Impact × Confidence) ÷ Effort
Then compare the results.
Do not stop at the spreadsheet. Review unusually high or low scores and ask whether any assumption appears inconsistent.
For a reusable calculation sheet, teams can create a RICE score calculator in Excel, Google Sheets, or a product-management tool. A basic calculator only needs four input fields and one formula.
RICE Prioritization Example (Worked)
Imagine a SaaS company deciding which of three initiatives should receive the next development cycle:
Initiative | Reach | Impact | Confidence | Effort |
Simplify onboarding | 6,000 | 2 | 80% | 3 |
Add CSV export | 2,500 | 1 | 100% | 1 |
Improve search | 8,000 | 1 | 50% | 4 |
Now calculate each score.
Simplify onboarding
(6,000 × 2 × 0.8) ÷ 3 = 3,200
Add CSV export
(2,500 × 1 × 1.0) ÷ 1 = 2,500
Improve search
(8,000 × 1 × 0.5) ÷ 4 = 1,000
Under these assumptions, the calculated RICE scores are:
Initiative | RICE Score |
Simplify onboarding | 3,200 |
Add CSV export | 2,500 |
Improve search | 1,000 |
This RICE prioritization example demonstrates why reach alone is not enough. Search has the highest reach, but its lower confidence and higher effort reduce its score.
The example also illustrates why confidence matters. If additional research increases confidence in the search initiative from 50% to 80%, its score becomes:
(8,000 × 1 × 0.8) ÷ 4 = 1,600
The initiative has not changed, but the evidence supporting the estimate has improved.
That is an important feature of RICE: new evidence can change the priority without changing the underlying idea.
The final decision should still consider dependencies, deadlines, customer commitments, compliance requirements, technical constraints, and strategy. Intercom explicitly notes that lower-scoring work may sometimes need to happen first because it is a dependency or a necessary "table stakes" capability.
RICE Scoring Template
A practical RICE prioritization template can be as simple as a spreadsheet.
The Columns Every RICE Template Needs
At minimum, include:
Column | Purpose |
Initiative | Name of the product opportunity |
Reach | Users/events in the agreed time window |
Impact | 3, 2, 1, 0.5, or 0.25 |
Confidence | Percentage confidence |
Effort | Estimated person-months |
RICE Score | (Reach × Impact × Confidence) ÷ Effort |
Evidence/Notes | Assumptions and supporting data |
Dependencies | Known sequencing constraints |
Adding an Evidence/Notes column is particularly useful. It prevents the spreadsheet from becoming a list of unexplained numbers.
Keeping Scoring Calibrated Across Teams
Two teams can interpret "high impact" differently. That can undermine the usefulness of RICE when scores are compared across teams.
Create shared definitions for each Impact level and use the same Reach window and Effort convention wherever practical.
Calibration sessions can also help. Select a few completed initiatives, estimate their RICE factors retrospectively, and compare the assumptions with what actually happened.
The goal is not to make every estimate perfect. It is to make the scoring process consistent enough to support useful comparisons.
Advantages of the RICE Framework
Reduces Bias and HiPPO-Driven Decisions
A common product-management problem is allowing the highest-paid person's opinion, often abbreviated as "HiPPO", to dominate prioritization.
RICE does not eliminate hierarchy or bias, but it creates a visible structure for questioning assumptions.
Instead of accepting "This is strategically important" as the end of the conversation, a team can ask:
- How many users are affected?
- What outcome is expected?
- How confident are we?
- How much work is required?
That makes assumptions easier to examine.
Makes Trade-offs Transparent to Stakeholders
Stakeholders may disagree about the priority of an initiative because they value different things.
A RICE table exposes the trade-off.
An executive may question the low Impact score. Engineering may challenge the Effort estimate. Product analytics may challenge Reach. Customer research may challenge Confidence.
Those disagreements are useful because they reveal where additional evidence is needed.
Scales Across Many Initiatives Quickly
Once a team has agreed on its definitions, RICE can be applied to a large list of initiatives relatively quickly.
A spreadsheet can automatically calculate every RICE score, allowing product managers to sort and filter the backlog.
However, scaling the spreadsheet is not the same as scaling good decision-making. Teams should still review the assumptions behind the numbers.
Limitations and Common Pitfalls of RICE
Garbage In, Garbage Out on Reach and Effort
A formula cannot correct poor inputs.
If a team estimates Reach at 20,000 users without reliable data, the resulting score may look scientific while resting on a weak assumption.
The same applies to Effort. Underestimating engineering complexity can artificially inflate an initiative's score.
Whenever possible, connect estimates to analytics, customer research, historical delivery data, engineering discovery, and experiments.
False Precision From Over-Trusting the Number
A score of 3,200 may look more precise than a score of 2,500, but neither is a measurement with scientific accuracy.
The inputs themselves are estimates.
This is why RICE should be used to structure judgment, not replace judgment. A small numerical difference may not be meaningful when the underlying assumptions are uncertain.
Ignoring Dependencies, Strategic Fit, and Urgency
RICE does not automatically account for every factor that matters.
An initiative may have a modest score but be legally required. Another may unlock several other initiatives. A third may need to launch before a fixed market deadline.
These constraints can legitimately override the calculated sequence.
The important thing is to make the exception explicit rather than pretending the score never existed.
RICE vs Other Prioritization Frameworks
RICE vs MoSCoW
RICE is quantitative and uses Reach, Impact, Confidence, and Effort.
MoSCoW prioritization uses four categories:
- Must Have
- Should Have
- Could Have
- Won't Have this time
MoSCoW is particularly useful when the key question is what must fit within a fixed delivery window. Its definitions emphasize whether the solution remains viable without a requirement.
RICE is more useful when a team needs to distinguish among multiple opportunities based on estimated impact and effort.
They can also be combined. For example, a team could first identify regulatory Must Haves using MoSCoW and then use RICE to prioritize discretionary features.
See the detailed guide toMoSCoW Prioritization for a deeper comparison.
RICE vs Value vs Effort Matrix
A value vs effort matrix typically plots initiatives on two dimensions:
- Expected value
- Required effort
Step 3: Score Impact, Confidence, and Effort
Use the team's agreed scales.
Step 4: Apply the Formula and Rank the Results
RICE Prioritization Example (Worked)
Imagine a SaaS company deciding which of three initiatives should receive the next development cycle:
Initiative | Reach | Impact | Confidence | Effor |
| Simplify onboarding | 6,000 | 2 | 80% | 3 |
| Add CSV export | 2,500 | 1 | 100% | 1 |
| Improve search | 8000 | 1 | 50% | 4 |
(6,000 × 2 × 0.8) ÷ 3 = 3,200
It is fast, visual, and easy to explain.
RICE adds Reach, Confidence, and a defined Impact scale, which can provide more differentiation when many initiatives occupy the same part of a matrix.
The trade-off is complexity. A two-axis matrix may be sufficient for a small workshop, while RICE can be more useful when teams need a repeatable numerical process.
RICE vs WSJF and Cost of Delay in SAFe
The RICE vs WSJF comparison is especially relevant for teams working in SAFe.
WSJF, or Weighted Shortest Job First, is the prioritization model used in SAFe to sequence work for maximum economic benefit. SAFe defines it as relative Cost of Delay divided by relative job duration. Its Cost of Delay considers dimensions including user and business value, time criticality, and risk reduction or opportunity enablement.
In simplified form:
WSJF = Cost of Delay ÷ Job Size
RICE instead uses:
RICE = (Reach × Impact × Confidence) ÷ Effort
The models therefore ask somewhat different questions.
RICE emphasizes who is affected, how much impact is expected, how confident the team is, and how much work is required.
WSJF emphasizes economic delay and job size, with the Cost of Delay components reflecting value, urgency, risk reduction, and opportunity enablement in SAFe.
Neither formula should be treated as universally interchangeable. The appropriate approach depends on the planning context, the information available, and the framework already used by the organization.
Using RICE Inside SAFe and Agile Backlogs
RICE can work alongside Agile and SAFe practices, especially when a team needs an extra lens to evaluate product opportunities.
SAFe uses WSJF officially for sequencing work like Features, Capabilities and Epics, so organizations using SAFe should realize that RICE is not a substitute for the SAFe WSJF method.
Or, a product team could use RICE during discovery or early feature evaluation and then use the organization’s required SAFe prioritization process at the appropriate backlog level.
like. e.g.
- There are plenty of opportunities for product management.
- Customer evidence and analytics are used to estimate Reach and Impact.
- RICE points to opportunities worth further investigation.
- Dependencies, architecture, compliance and strategic considerations are considered.
Features that are going into a SAFe ART backlog can then be prioritized using the WSJF process for the organization.
This distinction is important because there are prioritization frameworks at various levels.
If you're learning how product ownership works within SAFe, exploreSAFe POPM Certification Training and What Is Scaled Agile Framework.
Best Practices for RICE Prioritization
To make RICE prioritization useful rather than merely numerical, follow these practices:
- Define the measurement period first. "Reach" without a timeframe is difficult to compare.
- Use evidence wherever possible. Product analytics, customer research, historical data, and experiments can strengthen estimates.
- Standardize the Impact scale. Decide what 3, 2, 1, 0.5, and 0.25 mean for your organization.
- Use Confidence honestly. Do not assign 100% simply because a stakeholder strongly believes in an idea.
- Keep Effort estimates consistent. Decide whether the team will use person-months, person-weeks, or another shared unit.
- Document assumptions. Numbers without context are difficult to challenge or improve.
- Recalculate when evidence changes. A discovery experiment can materially change Reach, Impact, or Confidence.
- Separate priority from mandatory work. Compliance, security, contractual obligations, and critical incidents may require action regardless of RICE.
- Check dependencies. A lower-scoring technical enabler may need to precede a higher-scoring feature.
- Avoid over-precision. RICE is an estimation framework, not an accounting system.
- Review outcomes. Compare forecasts with actual adoption, impact, and delivery effort to improve future estimates.
- Use it as a conversation starter. The most valuable result may be identifying why stakeholders disagree about a score.
Teams that want to combine RICE with broader Agile approaches can also review theJobs To Be Done Framework. Jobs To Be Done can help teams understand the underlying customer problem before estimating the Reach and Impact of a potential solution.
Conclusion:
The RICE prioritization framework gives product teams a practical way to turn complex prioritization discussions into structured comparisons.
Its four components, Reach, Impact, Confidence, and Effort, capture different dimensions of a product decision. The formula (Reach × Impact × Confidence ) ÷ Effort rewards initiatives with a wide potential reach and significant impact, but also accounts for the uncertainty and effort required.
The framework is particularly useful in situations where there are many competing ideas in a backlog, and the stakeholders need to understand why one initiative looks to be ahead of another.
But RICE should never become a mechanical ranking machine. Estimates can be wrong, strategic priorities can change, and dependencies or deadlines can make a lower-scoring initiative necessary. The strongest teams therefore treat the RICE score as evidence that informs a decision rather than the decision itself.
Used consistently, and recalibrated as better evidence becomes available, RICE can make product prioritization more transparent, explainable, and repeatable.








 Lowest-Price Challenge











 Personalized Path


.webp)


 USA
USA  Canada
 India
India UK
UK Australia
 Singapore


