


 Call Us



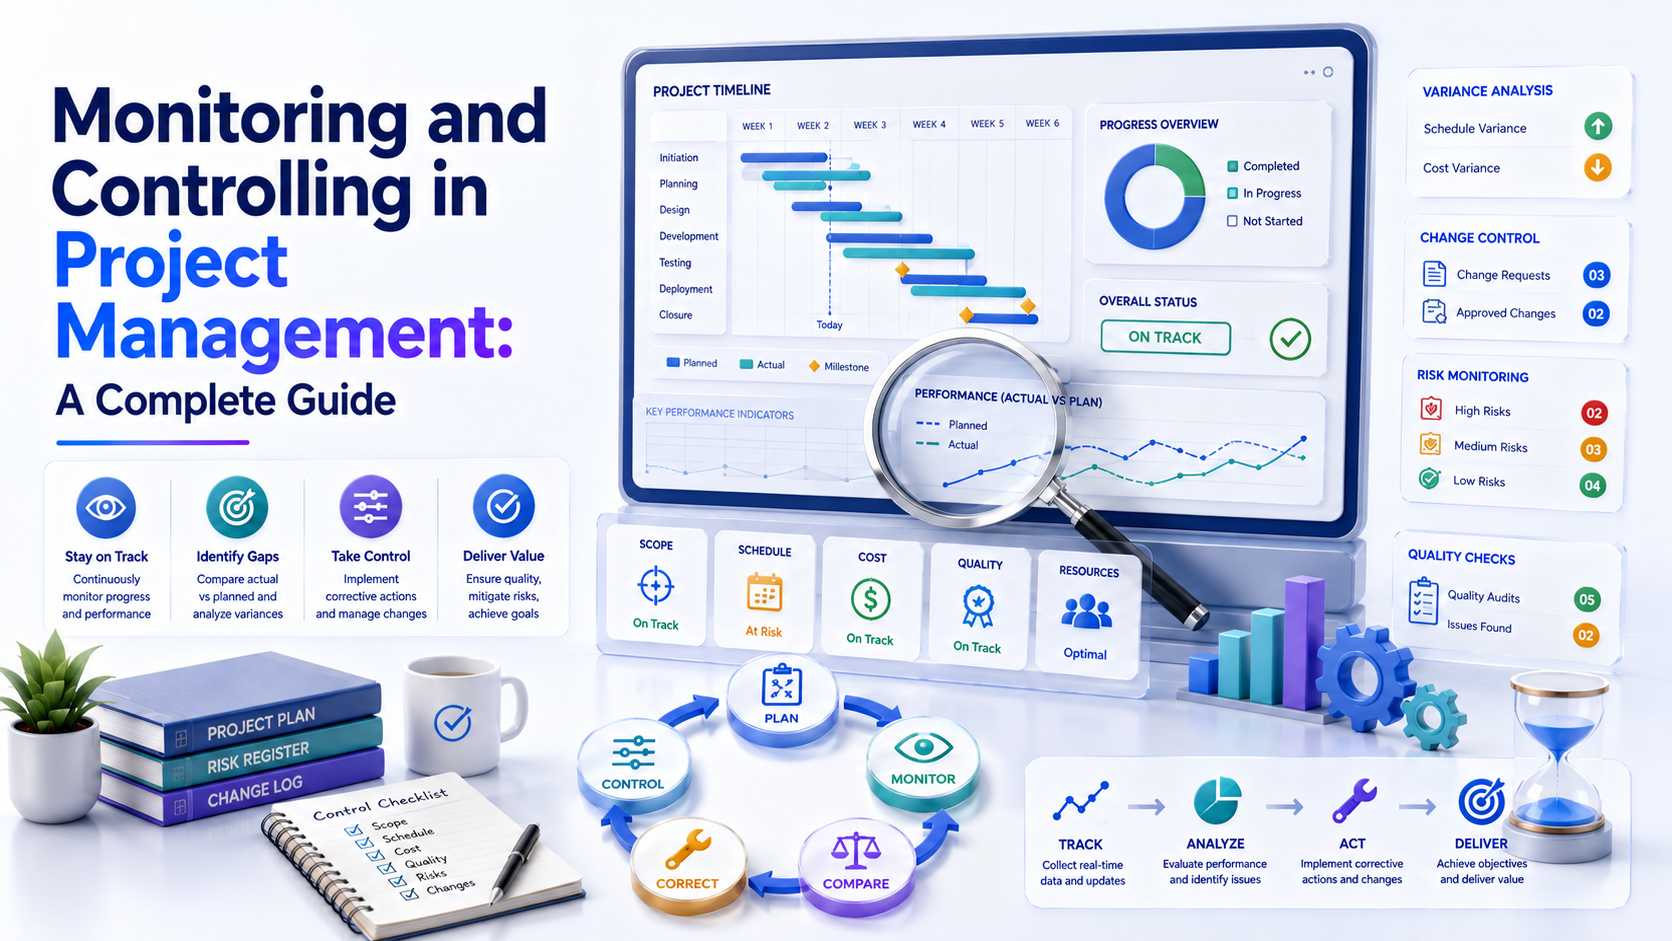
In project management, “monitoring” and “controlling” are the continuous practice of collecting project data, comparing actual performance with the approved plan, identifying variances, understanding their causes, and taking appropriate action when needed. In short, monitoring tells “what is happening” and controlling determines “what needs to be done next”
In the traditional PMBOK 6 process-group model, Monitoring and Controlling contained 12 processes covering integration, scope, schedule, cost, quality, resources, communications, risk, procurement, and stakeholder engagement.
Today, PMI uses a broader performance-based approach. PMBOK 7 organized project management around principles and performance domains, while the current PMBOK 8 retains performance domains and adds reintroduced process guidance in a more flexible form.
Key Highlight of Monitoring and Controlling in Project Management
- Monitoring collects and interprets information about project performance.
- Controlling uses that information to decide whether action is necessary.
- A project baseline provides the approved reference point for comparison.
- Variance does not automatically require corrective action.
- Tolerance thresholds help determine when a project manager can act and when escalation is necessary.
- The traditional PMBOK 6 model contains 12 Monitoring and Controlling processes.
- PMBOK 7 does not treat Monitoring and Controlling as a standalone process group.
- Dashboards and status reports support control, but they do not create control by themselves.
- Effective project control connects data with decisions, accountability, and action.
- PMBOK 8, published in November 2025, brings process guidance back as focus areas while retaining performance domains.
Introduction
What if your project dashboard says “on track,” but the project tells a different story? In reality, the team might be accumulating unresolved defects, depending on an unavailable resource, delaying decisions, or quietly accepting unapproved scope changes.
That is where project monitoring and control become important. Monitoring is not simply checking whether the tasks are completed, but rather it is a structured way of understanding how the project is progressing against expectations. Whereas controlling begins when that information (drawn from monitoring) is used to make a decision. For example, if a project is planned to spend ₹20 lakh by the end of month four but has actually spent ₹23 lakh, monitoring identifies the difference. Control goes one step further. It considers what the project team has researched, why it has exceeded the budget, evaluates the effect of the overspend, and chooses whether to take corrective action, make a change request, or do nothing.
PMI’s Pulse of the Profession researchis also consistent with a broader view of project success. Traditional measures like scope, schedule, and cost are still important, but PMI now places more emphasis on whether a project delivers value that justifies the effort and expense.
What Is Monitoring and Controlling in Project Management?
Monitoring and controlling in project management is the ongoing process of tracking project performance, comparing actual results with approved expectations, identifying deviations, evaluating their causes and impacts, and taking appropriate action. In simple terms,
Monitor → Compare → Analyze → Decide → Act → Recheck
While monitoring provides visibility, controlling responds. For example, suppose a software project has a target of completing 80% of planned functionality by the end of Sprint 6. At the review stage,
- Planned completion = 80%
- Actual completion = 68%
- Variance = 12 percentage points
The 12-point difference is a signal, not automatically a failure. The project manager may discover that two senior developers were reassigned to another project. The response could involve resource reallocation, scope sequencing, schedule adjustment, or escalation. If the change affects an approved baseline, formal change control may also be required.
This is why project monitoring and evaluation should not stop at collecting numbers. The useful question is what those numbers mean and what decision should follow.
Where Monitoring and Controlling Fits Among the Five Process Groups
In the traditional PMBOK 6 model, project management was organized into five process groups (referred to as thefive phases of project management ). Here they are:
| Process Group | Main Purpose |
| Initiating | Define and authorize the project or phase |
| Planning | Establish the approach, baselines, and plans |
| Executing | Perform the planned project work |
| Monitoring and Controlling | Track performance, identify variances, and manage changes |
| Closing | Complete the project or phase formally |
Both monitoring and controlling overlap with execution rather than waiting until execution is finished. The project teams collect performance information while work is being performed and use it to determine whether the project remains aligned with the plan. PMI’s process-based material describes monitoring as tracking, reviewing, and regulating project progress and performance, identifying where changes may be needed, and initiating appropriate changes.
Monitoring vs Controlling With a Simple Project Example
With a hypothetical example, let’s understand monitoring and controlling in a better way:
A company is going to implement a new customer relationship management system. The approved schedule says user testing should be completed by June 30. By June 20, “monitoring” identifies that:
- 75% of test cases were planned to be completed.
- But only 60% have been completed.
- Several critical defects remain unresolved.
- Two business users are unavailable for final validation.
Now, “controlling” asks:
- Why is testing behind?
- Will the delay affect the release?
- Can the remaining work be recovered in due time?
- Is additional support needed?
- Does the schedule require a formal change?
- Who needs to approve that change?
From the above simple project example, we can conclude that the difference between monitoring and controlling is subtle but important. One observes performance, whereas the other manages the response to performance information.
Difference Between Monitoring and Controlling in Project Management?
The difference between monitoring and controlling is clearer when we consider these activities as connected but distinct parts of a driving loop, where monitoring is checking your speedometer and controlling is stepping on the brakes or gas to adjust your speed.
| Monitoring | Controlling |
| Collects project information | Uses information to make decisions |
| Tracks actual performance | Compares performance with approved expectations |
| Identifies trends and variances | Determines whether intervention is needed |
| Provides visibility | Drives corrective or preventive action |
| Answers “What is happening?” | Answers “What should we do?” |
| May involve dashboards, reports, metrics, inspections | May involve corrective action, escalation, or change control |
| Continues throughout the project | Occurs when analysis indicates a response is appropriate |
Neither activity is sufficient by itself. A team that monitors everything but never responds is not exercising effective control. Likewise, a team that makes changes without reliable monitoring may react to assumptions rather than evidence.
Monitoring and Controlling Process Group: The 12 Processes Explained
The Monitoring and Controlling Process Group in the traditional PMBOK 6 model contains 12 processes. They span multiple knowledge areas rather than representing 12 steps that must always be performed sequentially.
| Process | Primary Focus |
| Monitor and Control Project Work | Overall Project Performance |
| Perform Integrated Change Control | Evaluate and manage changes |
| Validate Scope | Formal acceptance of completed deliverables |
| Control Scope | Manage scope and prevent uncontrolled changes |
| Control Schedule | Manage schedule performance |
| Control Costs | Manage cost performance |
| Control Quality | Verify outputs against quality requirements |
| Control Resources | Monitor resource use and availability |
| Monitor Communications | Check whether communication is effective |
| Monitor Risks | Track existing and emerging risks |
| Control Procurements | Manage supplier and contract performance |
| Monitor Stakeholder Engagement | Assess stakeholder relationships and engagement |
Monitor and Control Project Work
This process looks at the project as a whole. The project manager gathers performance information, reviews trends, compares actual results with the project management plan, and determines whether changes or corrective actions are necessary.
Typical information includes:
- Schedule progress
- Cost performance
- Scope status
- Quality results
- Risks and issues
- Resource information
- Change requests
- Forecasts
It is essentially the project-level control point where separate performance signals are brought together.
Perform Integrated Change Control
It evaluates proposed changes and determines their effects on scope, schedule, cost, resources, risk, and quality. A change to the release date could affect vendor contracts, resource allocation, testing, stakeholder commitments, and budget.
Therefore, the process looks beyond the immediate request. PMI’s PMBOK 6 material shows change requests flowing from monitoring and control into integrated change control. Knowing change control management and its stepsis a vital skill when a proposed change needs a more detailed review.
Validate Scope and Control Scope
These processes are often confused. Validate scope focuses on formal acceptance of completed deliverables. Control Scope is about controlling changes to the project scope and helping teams avoid scope creep. For example: The team finishes a reporting module.
- The team completes a reporting module.
- The customer reviews it.
- The customer formally accepts it.
That is related to Validate scope. If the customer then asks for three additional reports that were not included in the approved scope, the request enters the territory of scope control and potentially integrated change control.
Control Schedule and Control Costs
These processes focus on whether the project is progressing and spending according to approved expectations.
Schedule control may examine:
- Milestone delays
- Activity completion
- Dependencies
- Critical-path effects
- Schedule forecasts
Cost control may examine:
- Actual expenditure
- Budget variance
- Cost trends
- Forecasts
- Earned value measures
For projects using earned value management, metrics such as CPI and SPI can help interpret cost and schedule performance.
Control Quality and Control Resources
Control Quality determines if project deliverables meet quality requirements or not. This includes inspection, testing, defect analysis, measurements, checklists, and statistical techniques.
Control Resources focuses on whether physical and other project resources are being used and managed appropriately.
For example, a project may technically remain on schedule while consuming specialist resources at twice the expected rate. That is a resource-control signal even if the schedule dashboard remains green.
Monitor Communications and Monitor Risks
Communication control is not simply checking whether a report was sent. The important question is whether the right information reaches the right people in a useful form and at the right time.
Risk monitoring, meanwhile, tracks identified risks, residual risks, new risks, triggers, and the effectiveness of risk responses. A risk that was previously considered low may become significant because project conditions changed. Monitoring helps in detecting that shift.
Control Procurements and Monitor Stakeholder Engagement
Supplier performance can affect schedule, cost, quality, and risk. Control Procurements checks whether the procurement activities and contractual performance are aligning with the expectations.
Monitor Stakeholder Engagement looks at stakeholder relationships and engagement levels. A stakeholder who initially supported the project may become less engaged after repeated delays. That change can become a project risk even if no technical problem has occurred.
Monitoring and Controlling in PMBOK 7 vs PMBOK 6
This is one area where older articles can create confusion. PMBOK 6, the sixth edition of the PMBOK Guide, used a process-based structure with five process groups and 49 processes, including the 12 Monitoring and Controlling processes discussed above. PMBOK 7 changed the structure. PMI moved from process groups and knowledge areas as the primary organizing framework toward principles and project performance domains. PMI also clarified that practitioners could still use process groups when appropriate; they were not prohibited.
| PMBOK 6 | PMBOK 7 |
| Process-based structure | Principle- and performance-domain-based structure |
| Five process groups | Eight performance domains |
| 49 processes | No equivalent 49-process structure |
| Monitoring and Controlling was a named process group | No standalone Monitoring and Controlling process group |
| Detailed process flow | Greater emphasis on outcomes and tailoring |
| Knowledge areas | Performance domains replace them as the primary organizing structure |
PMBOK 7's performance domains included areas such as Measurement, Project Work, Delivery, Planning, Stakeholders, Team, Development Approach and Life Cycle, and Uncertainty.
An Important 2026 Update: PMBOK 8
PMBOK Guide Eighth Edition is the current edition in 2026. PMI states that it retains the principles and performance-domain foundation of the seventh edition while reintroducing process guidance in an evolved, non-prescriptive form. It has six core principles and seven performance domains.
So, if you are studying the 12 Monitoring and Controlling processes, treat them as the traditional PMBOK 6 process-group model, not as a literal PMBOK 7 structure.
How Project Control Works: Baselines, Variance, and Tolerance?
Project control becomes much easier to understand when you connect three ideas:
Baseline + Actual Performance + Tolerance
A project baseline is an approved reference point against which actual performance can be compared. Depending on the project, baselines may include scope, schedule, and cost information. For example:
| Measure | Baseline | Actual | Variance |
| Planned cost | ₹50 lakh | ₹54 lakh | +₹4 lakh |
| Planned completion | 80% | 74% | -6 percentage points |
| Defect rate | ≤2% | 3.5% | +1.5 points |
Tolerance is the degree of variation that is acceptable before corrective action or escalation is required. For example, if a project has an approved tolerance of 5% for a cost variance, a difference of a few points may be within the approved tolerance. A larger variance may require investigation, corrective action, or escalation to the appropriate stakeholder. The variance tells you that something is different. It does not, by itself, explain why.
That distinction prevents a common project-control mistake: reacting to every difference as though it were an emergency.
Work Performance Data vs Information vs Reports
These three terms, work performance data, information, and report, can be understood as different levels of processing.
Work performance data is raw project information collected during execution. For example,
- 42 tasks completed
- ₹8 lakh spent
- 12 defects identified
- Three risks triggered
Work performance information is analyzed data. The work performance report is the package of relevant information for stakeholders. A project sponsor may receive a concise dashboard, while the project team may need detailed schedule and defect information.
The progression is: Data → Analysis → Information → Report → Decision
When Does a Variance Require Corrective Action?
Not every variance requires intervention or corrective action. A project manager should consider,
- Size, i.e., how large is the variance?
- Trend, i.e., is it temporary or recurring?
- Impact, i.e., what happens if it continues?
- Cause, i.e., what created the variance?
- Tolerance, i.e., is it within the approved threshold?
- Forecast, i.e., what is the likely future effect?
- Authority, i.e., can the project manager resolve it directly?
For example, a one-day delay in a non-critical activity may not justify a change request. A one-day delay on a critical activity that affects a contractual milestone may need immediate action.
The Monitoring Trap: Why Teams Measure Everything and Change Nothing
A project dashboard can contain 30 metrics and still tell you very little. The problem is not usually a lack of data, but rather it is the gap between measurement and decision-making.
A team may track budget, schedule, defects, risks, issues, resource utilization, customer satisfaction, milestones, and change requests. But if nobody has defined what should happen when a metric moves outside its acceptable range, the dashboard becomes a reporting exercise rather than a control mechanism.
6 Signs That Your Project Is Being Watched – Not Managed
1. The variance is the same every week; the team reports it but doesn’t know the cause.
2. Red status indicators are owned by nobody; Everybody knows there is a problem, but nobody owns the problem.
3. Reports are retrospective, not predictive; The team spends time telling what happened yesterday, not what is going to happen tomorrow.
4. Change requests are approved; Work input for the teams is via emails or conversations without impact to scope, cost, or schedule.
5. No thresholds; The team has metrics, but no agreed point where escalation or intervention is needed.
6. Meetings end with observations, not decisions; The project team identifies problems but leaves them without anything clear to do, an owner, or a deadline.
Why Dashboards and Status Reports Do Not Automatically Create Control?
A dashboard is a visibility tool. Control requires a management mechanism behind that visibility. A useful dashboard should ideally connect each important metric with:
Metric → Threshold → Owner → Decision → Action → Follow-up
For example:
Schedule variance exceeds 10% → Project Manager reviews root cause → Recovery plan prepared → Sponsor approval required if baseline changes → Progress reviewed next week.
Who Can Authorize a Corrective Action on Your Project?
The project governance structure, delegated authority, organizational policies, and the effect of the proposed action on a project determine who can authorize a corrective action. A project manager may be able to make routine adjustments as long as they stay within the approved tolerances. But if a change affects an approved baseline, it may need formal approval from the project sponsor, change control board, product owner, or another person with the appropriate authority.
Setting Tolerance Thresholds and Escalation Authority Before You Need Them
Before execution gets complicated, you must define:
- What variance can the project manager handle?
- What requires a formal change request?
- Who approves scope changes?
- What requires sponsor notification?
- Who approves additional funding?
When Should the Project Manager Act, Escalate, or Raise a Change Request?
The key distinction is whether the response can occur within the existing approved plan. If the team can solve the problem without changing an approved baseline, a corrective action may be enough. Again, a formal change process is also necessary, but only if resolving the issue requires changing the approved scope, schedule, cost, or another controlled element. This is the reason why corrective action and change requests are not interchangeable.
Project Variance Analysis Example: From Data to Root Cause and Corrective Action
Let us consider a six-month software implementation project. After four months, the team reviews its performance and notices two immediate concerns:
- Cost variance of ₹4 lakh (over plan)
- Progress variance is 8 percentage points
After completing four months, it is seen that:
- Planned budget = ₹40 lakh
- Actual cost = ₹44 lakh
- Planned completion = 70%
- Actual completion = 62%
But these figures only tell us what has happened. Also, to effectively manage a project, the team needs to understand why the variance occurred, what it could affect, and what action needs to be taken.
| Step | Description | Details |
| Step-1: Identify the variance | Compare where the project is now with where it was supposed to be | Cost variance: ₹4 lakh Progress variance: 8% |
| Step-2: Investigate the cause | Find out the reason behind the difference | The team finds that integration testing is taking longer than expected. Reason: the external API documentation was incomplete |
| Step-3: Assess the impact | After identifying the cause, figure out how the issue could affect the rest of the project | The problem could affect testing effort, specialist resource usage, release timing, vendor coordination, and the cost forecast |
| Step-4: Identify response options | Identify how to practically deal with the issue | The options may be an additional integration specialist, issue escalation with the vendor, re-sequencing testing activities should be re-sequencing, and reduction of non-critical parallel work |
| Step-5: Decide whether a formal change is needed | Check whether the team can handle the response | If support lasts within the approved budget and schedule, the project manager can act directly. If it needs extra funding or changes the release date, a formal change request may be required. |
| Step-6: Monitor the response | Check continuously whether it is actually helping the project get back on track
| The project manager should check whether testing improves, costs stabilize, the schedule recovers, and the vendor issue is resolved. The action still needs to be monitored after the decision is made.
|
Leading Indicators That Warn You Before Variance Appears
A lagging indicator tells you what has already happened. A leading indicator provides an earlier signal that a future problem may be developing. For example, a missed milestone is a lagging signal. Increasing dependency delays before the milestone is missed may be a leading signal.
Schedule, Quality, Risk and Resource Signals to Track Early
| Area | Possible Leading Indicator |
| Schedule | Increasing dependency delays |
| Quality | Rising defect trend |
| Risk | Increasing risk exposure |
| Resources | Growing specialist workload |
| Scope | Increasing unresolved requirements |
| Stakeholders | Falling participation in key decisions |
| Procurement | Repeated supplier delivery slippage |
| Communication | Increasing clarification requests |
The exact indicators should be tailored to the project. A construction project, software implementation, and marketing transformation will not need the same control dashboard.
Leading vs Lagging Indicators in Project Control
| Leading Indicator | Lagging Indicator |
| Predicts potential future performance | Shows past performance |
| Helps prevent problems | Helps confirm problems |
| Increasing defect trend | Defects already exceeded threshold |
| Resource overload forecast | Resource shortage occurred |
| Risk exposure increasing | Risk event occurred |
| Approval delays developing | Milestone missed |
Monitoring and Controlling in Agile, Hybrid and Indian IT Projects
Agile does not remove monitoring and controlling. It changes what teams monitor and how they keep the project on track. In a predictive project, the team may monitor performance against a relatively stable scope, schedule, and cost baseline.
In Agile, some aspects of scope are intentionally flexible. The team may instead monitor:
- Product backlog health
- Sprint progress
- Cycle time
- Throughput
- Defect trends
- Release forecasts
- Customer feedback
- Team capacity
- Dependencies
- Product outcomes
PMI's research notes that predictive, hybrid, and agile approaches can all perform effectively when the approach fits the project context, which is why many organizations now adopt hybrid project management.
Monitoring Progress When Scope Is Deliberately Flexible
Flexible scope does not mean there is no control. For example, an Agile product team may keep the release date relatively stable while allowing lower-priority features to move.
The control question becomes: Are we still delivering the intended outcome within the agreed constraints?
That is different from asking whether every originally imagined feature will be delivered.
Weekly Governance, SLA Metrics and Client-Owned Baselines
This is especially relevant to Indian IT services and outsourced delivery environments. A weekly governance review might track:
- Sprint or release progress
- SLA compliance
- Defect severity
- Open risks
- Resource availability
- Client dependencies
- Change requests
- Escalations
- Financial performance
Client-owned baselines can also influence control. If a client has committed to providing data, approvals, environments, or subject-matter experts by specific dates, those dependencies should be monitored rather than treated as informal assumptions. The goal is not to create more reports. It is to make deviations visible early enough to do something about them.
Monitoring and Controlling for PMP and CAPM Exams
Monitoring and Controlling remains useful exam knowledge, particularly when studying the traditional process-based model. However, candidates preparing in 2026 need to distinguish historical PMBOK process terminology from the current PMP exam structure. PMI launched the updated PMP examination on 9 July 2026. It follows the updatedPMP Exam Content Outline 2026. The new PMP exam has 180 questions and 240 minutes, with three domains:
- People: 33%
- Process: 41%
- Business Environment: 26%
PMI also states that approximately 40% of questions represent predictive approaches, while the remaining 60% cover adaptive/agile and hybrid approaches.
The current PMP exam also includes change control, governance, risk, impediments, compliance, and performance-related decision-making, even though the exam is not structured as a simple test of the old five process groups. For CAPM, PMI has a 150-question, 180-minute exam on project management basics, predictive methodologies, Agile frameworks/methodologies, and business analysis. If you are new to the field, CAPM certification training can help you build a strong foundation in these areas.
Common Exam Traps: Monitor vs Control, Change vs Corrective Action
Trap 1. Monitoring solves the problem
No. Monitoring is about identifying and analyzing the situation. Response is determined and managed by control.
Trap 2: All variances need a change request.
No. Some variations can be controlled to approved tolerances.
Trap 3: Change request and corrective action are the same thing.
They don’t. Corrective action is a response to a performance deviation. If a change is required, a change request is a formal proposal to change a controlled project element.
Trap 4: Validate Scope is managing the scope.
Validate Scope consists of the formal acceptance of deliverables. Control Scope controls scope changes.
Trap 5: If the dashboard is green, the project is successful.
Not in the least. The definition of success is increasingly based on outcomes and value, not just execution metrics.
If you are preparing for PMP certification, you can also check out PMP certification training along with the current PMI examination requirements.
Conclusion
Effective monitoring and controlling in project management is not about creating more reports or watching dashboards throughout the day. It is about creating a reliable feedback loop:
Plan → Measure → Compare → Understand → Decide → Act → Reassess
This idea is formalized by the 12 Monitoring and Controlling processes of the traditional PMBOK 6 model. These processes are still useful for understanding concepts such as scope validation, cost control, schedule control, risk monitoring, stakeholder engagement, and integrated change control.
However, it is important not to confuse that historical structure with the current PMI framework. PMBOK 7 was more focused on principles and performance domains. PMBOK 8 is coming in 2025 and builds on those foundations, but also reintroduces process guidance more flexibly.
The practical lesson is straightforward: measurement only becomes control when it leads to an informed decision and appropriate action.
A project does not need every metric available. It needs the right measures, meaningful thresholds, clear ownership, and a defined response when performance moves away from expectations.





 Lowest-Price Challenge











 Personalized Path


.webp)


 USA
USA  Canada
  India
India  UK
UK  Australia
  Singapore


