


 Call Us




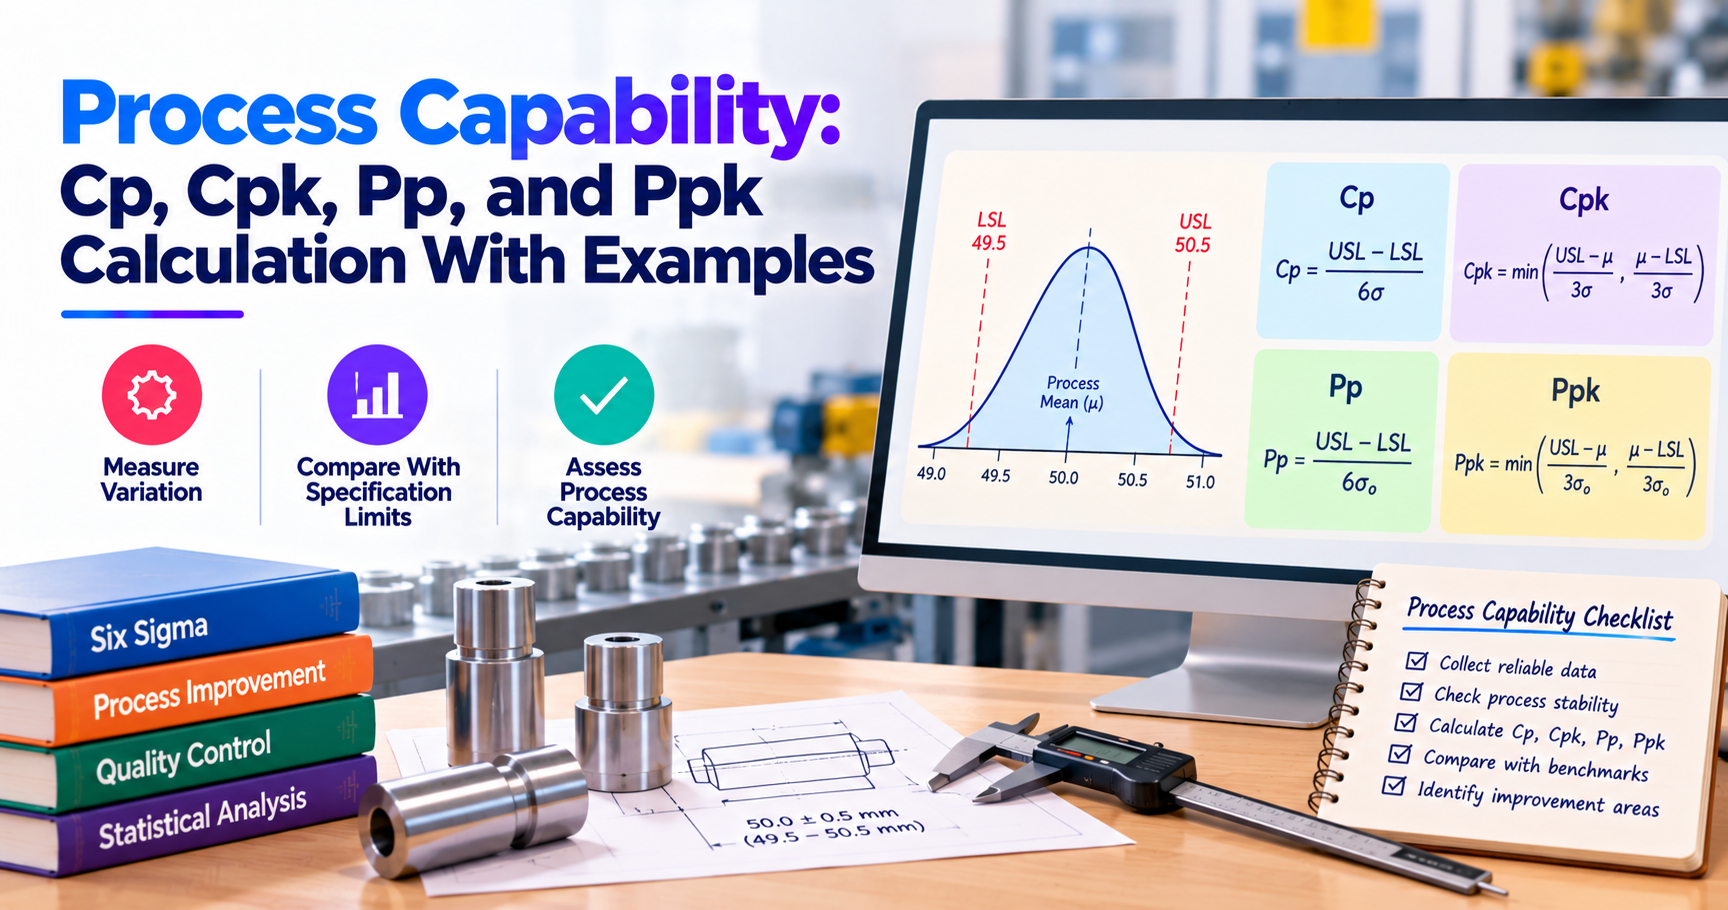
A process can produce hundreds of acceptable products and still have a quality problem waiting to happen. If its measurements differ too much, the next batch could contain products that fall outside the required specifications. Process capability helps teams understand that risk before it turns into a problem that’s too costly.
It measures how well a process can produce outputs within the limits set by customers or engineering requirements.
There are four indicators used for this: Cp, Cpk, Pp, and Ppk. Cp compares the specification range with short-term process variation, while Cpk also considers how close the process mean is to either specification limit. Pp and Ppk use overall variation to assess process performance across the period being studied.
A higher index usually means that there’s better capability or performance. But the result is only useful when the process is stable, the measurement system is reliable, and the data are suitable for the calculation.
Key Highlights of Process Capability
- Process capability helps determine whether a process can consistently meet customer requirements.
- Cp measures the specification range relative to within-process variation.
- Cpk accounts for both process variation and the distance between the process mean and the nearest specification limit.
- Pp and Ppk use overall variation to assess process performance over the observed period.
- A Cpk of 1.33 is a common benchmark in manufacturing, although actual requirements vary.
- Reliable measurements, adequate sample sizes, and process stability are essential for meaningful capability analysis.
Introduction
Think of a factory that churns out thousands of metal parts every day. Each part has a dimension requirement to be satisfied. Most products pass inspection but some may be a little too big or a little too small. Taken one by one, these differences may not appear very important. But over the life of a production run, they can mean wasted material, rejected batches, delayed deliveries, and extra cost.
It may not solve the problem, but it may help in detecting the defects inspecting more products. So a better question to ask is why does the process keep generating measurements out of the acceptable range?
This is where process capability comes into play.
Instead of just counting the number of bad products, teams can measure the variability of the process and compare that variability to the specification limits. This gives them a better image if the process is constantly meeting quality requirements.
Capability analysis is particularly helpful to Six Sigma practitioners because it links statistical measures to practical decisions. This helps answer questions such as whether a process needs better centering, whether variation is too high, and whether an improvement has actually made a difference.
Knowing what Cp, Cpk, Pp, and Ppk are gives you the tools to answer these questions instead of assuming.
What Is Process Capability?
Process capability describes the ability of a process to produce outputs within a defined range of acceptable values. That range is usually set up by customer requirements, engineering specifications, regulatory standards, or internal quality guidelines.
Let’s say a manufacturer producing metal shafts. Each shaft must have a diameter between 49.5 mm and 50.5 mm. If measurements consistently fall within this range, that means that the process may be capable of meeting the requirement. If shafts keep falling below 49.5 mm or exceed 50.5 mm, the team needs to investigate.
It’s important to keep in mind that a few successful measurements don't tell the whole story. A process might produce ten acceptable components in a row and still have a lot of variation across a full production run.
Capability analysis compares the spread of process measurements and, where relevant, the process mean with the specification limits. The resulting process capability index helps teams understand how much room the process has before its outputs fall outside the acceptable range.
These measurements are widely used in manufacturing to assess dimensions, thickness of components, and other measurable characteristics. Similar methods can help quality improvement in service operations, provided the data and statistical assumptions are appropriate.
In practical terms, process capability helps answer a straightforward question: can the process meet the required standard consistently, or is its current variation putting quality at risk?
Specification Limits vs Control Limits
Specification limits and control limits are often shown on charts, but they don't mean the same thing.
Specification limits are the allowable range of results for an output of a product or process. Customers, engineering teams, regulators, or internal requirements often set such limits.
Control limits are determined from process data. They help teams understand how a process is performing over time and identify unusual changes in performance.
So if a manufacturer has to produce shafts that are between 49.5 mm and 50.5 mm, these become specification limits. The process may be such that the control chart shows a lower control limit of 49.6 mm and an upper control limit of 50.4 mm.
To help you remember the difference, think of the questions for each set of limit answers:
- Specification limits inform you if the output is up to the required standard.
- Control limits are used to determine whether the process is consistent.
Too much variation, even in a stable process, can result in too many defective products. In contrast, a process may be producing products within acceptable limits for a number of days, but with unexpected changes. The future performance of the process is difficult to predict.
Continuously reviewing control charts helps teams identify these patterns before interpreting capability results. It also prevents the common mistake of assuming that a process is capable just because its measurements seem to be within the acceptable range.
Short-Term vs Long-Term Capability
The performance of a process may vary depending upon when and how it is measured. One shift a machine may work, and the next shift gives a different result. These differences can be ascribed to raw materials, equipment condition, and operating practices.
Short-term capability deals with changes in relatively stable operating conditions. It generally uses variation within subgroups and is represented by Cp and Cpk.
Long-term process performance is considered in terms of total variation over the period of observation. This variation may be due to differences in shifts, batches, machines, and other operating conditions. Pp and Ppk measure performance in relation to the overall standard deviation.
Let's say a filling machine is very consistent with its fill volumes all morning. But during the evening shift, the changes of machine settings increase the dispersion of the measures. If the team is looking at just the morning shift, they may get a rose-tinted and false view of performance.
And that’s why both perspectives matter. Short-term capability reflects the process behavior under relatively stable conditions. Overall performance reflects what happens across the operating conditions represented in the data.
Process Capability Indices
Cp, Cpk, Pp, and Ppk all help determine process quality (NIST/SEMATECH e-Handbook: process capability), but they focus on different aspects of performance. Understanding such differences makes it easier to choose the right calculation and explain what the results mean.
Cp
Cp measures the potential capability of a process by comparing the specification width with six times the estimated within-process standard deviation.
The Cp formula is:
Cp = (USL − LSL) / 6σwithin
Where:
- USL = Upper specification limit
- LSL = Lower specification limit
- σwithin = Estimated within-process standard deviation
Cpk
Cpk builds on Cp by accounting for the position of the process mean. It measures the distance between the mean and each specification limit, relative to the within-process variation.
The Cpk formula is:
Cpk = min [(USL − μ) / 3σwithin, (μ − LSL) / 3σwithin]
Where μ represents the process mean.
Pp and Ppk
Pp and Ppk work much like Cp and Cpk, but they use overall process variation rather than within-process variation (Minitab Support: capability analysis).
The Pp formula is:
Pp = (USL − LSL) / 6σoverall
The Ppk formula is:
Ppk = min [(USL − μ) / 3σoverall, (μ − LSL) / 3σoverall]
Cpk and Ppk Compared
Cpk and Ppk both account for process centering. The main difference is the difference used in each calculation.
| Feature | Cpk | Ppk |
| Purpose | Estimates process capability | Measures observed process performance |
| Variation used | Within-process standard deviation | Overall standard deviation |
| Time perspective | Within-subgroup or short-term variation | Variation across the observed data period |
| Common application | Evaluating capability under relatively consistent conditions | Evaluating performance across actual operating conditions |
| Key consideration | May not reflect additional between-subgroup variation | Reflects overall variation during the period studied |
So, let’s say a process has a Cpk of 1.50 but a Ppk of 1.10. The difference implies that the overall variation is greater than within-process variation.
The team can use this to investigate whether different shifts use different machine settings, whether raw materials vary between batches, or if equipment performance changes over time.
If Cpk and Ppk are close, the difference between within-process and overall variation may be smaller. But having similar values doesn’t automatically prove that the process is stable or capable.
To get a broader view of how capability indices fit into quality measurement, explore these Six Sigma metrics.
How to Calculate Cpk Step by Step
The Cpk formula is relatively simple. The difficulty lies in making sure you have the right data and an appropriate estimate of process variation.
Here's how to calculate process capability step by step.
Step 1: Identify the specification limits.
Start with the upper and lower specification limits from the customer requirements, engineering drawings, or quality documentation. These limits mark what is acceptable. Do not use control limits in lieu of them.
Step 2: Collect representative process data.
Measure the output enough to see how the process behaves. Depending on the application, this may mean measurements taken across different shifts, different batches, different machines, or different times.
Step 3: Check process stability.
Use a suitable control chart to look for special cause variation, e.g., unusual shifts or trends. If the process is unstable, look at what changed before believing a typical capability estimate.
Step 4: Calculate the process mean.
Add the measured values together and divide by the number of measurements. This gives you the mean of the process.
Step 5: Estimate within-process standard deviation
Choose a statistical method that matches your sampling design. For data that have been subgrouped, short-term variation is often estimated using within-subgroup variation.
Step 6: Calculate the upper and lower capability values.
Calculate:
Cpu = (USL − μ) / 3σwithin
Cpl = (μ − LSL) / 3σwithin
Step 7: Select the smaller value.
Cpk = min (Cpu, Cpl)
The smaller value becomes Cpk because it represents the specification limit closest to the process mean relative to the estimated variation.
For more guidance on collecting and analyzing process data, the DMAIC measure phase explains how measurement supports effective improvement decisions.
Worked Example
Let’s say a company manufactures plastic parts with a target diameter of 20 mm. Each component must measure between 19.5 mm and 20.5 mm.
After collecting representative measurements and checking that the process is stable, the team estimates the following:
- USL = 20.5 mm
- LSL = 19.5 mm
- Process mean = 20.1 mm
- Within-process standard deviation = 0.1 mm
Let's calculate Cpk.
First, calculate Cpu:
Cpu = (20.5 − 20.1) / (3 × 0.1)
Cpu = 0.4 / 0.3 = 1.33
Next, calculate Cpl:
Cpl = (20.1 − 19.5) / (3 × 0.1)
Cpl = 0.6 / 0.3 = 2.00
Finally, select the smaller value:
Cpk = min (1.33, 2.00)
Cpk = 1.33
The result tells us that the process is closer to the upper specification limit. The upper side therefore determines its capability score.
What should the team do next? Rather than immediately investing in new equipment, it could first investigate why the average is above the 20 mm target.
If the team can bring the process closer to 20 mm without increasing variation, it will create more room on both sides of the specification range. That could improve Cpk and reduce the risk of defects.
Sample Calculation Table
The worked example can be summarized as follows.
| Parameter | Value |
| Upper specification limit | 20.5 mm |
| Lower specification limit | 19.5 mm |
| Process mean | 20.1 mm |
| Within-process standard deviation | 0.1 mm |
| Cpu | 1.33 |
| Cpl | 2.00 |
| Cpk | 1.33 |
Calculating both Cpu and Cpl is important because the process may have plenty of room on one side and very little on the other. Looking at just one value would leave you with an incomplete picture.
Interpreting Results
Once you've calculated a process capability index, the next step is to understand what it means for the process.
A Cpk below 1 indicates that the distance from the process mean to at least one specification limit is less than three within-process standard deviations. Under suitable statistical assumptions, this suggests a greater risk of producing outputs outside the acceptable range.
A Cpk of 1 means the nearest specification limit is three within-process standard deviations from the mean. Higher values generally indicate a greater margin between the mean and that limit.
However, a high Cpk doesn't automatically mean that the process is performing perfectly. An unstable process, unreliable measurements, or unsuitable data can make the result misleading.
Capability indices should also be considered alongside actual defect rates, process trends, and customer requirements. Used together, these measures help teams understand what's happening and decide where improvement efforts will have the greatest impact.
Cpk Benchmarks and Sigma Levels
The right Cpk target depends on the process and the consequences of getting it wrong. A manufacturer producing a non-critical plastic component may have different requirements from a company producing safety-critical automotive parts.
The following values are common reference points, rather than universal acceptance criteria. The 1.33 and 1.67 targets are widely used in automotive work, as described in the AIAG Statistical Process Control (SPC) core tool.
| Cpk value | General interpretation |
| Below 1.00 | Process may not consistently meet specifications |
| 1.00 | Limited capability margin |
| 1.33 | Common benchmark in many manufacturing applications |
| 1.67 | Higher target used in some demanding applications |
| 2.00 or above | Very high estimated capability under suitable assumptions |
Cpk is also related to sigma level. For a centered process following a normal distribution, Cpk = 1.00 means the specification limits are three standard deviations from the mean. A centred process with Cpk = 1.33 has specification limits approximately four standard deviations from the mean.
You may also encounter the widely cited Six Sigma target of 3.4 defects per million opportunities (DPMO). This figure uses a convention that assumes a 1.5-sigma long-term shift. It shouldn't be treated as a direct, universal conversion from Cpk to DPMO.
Keeping these distinctions clear helps teams avoid confusing process capability with actual defect rates. For additional background, see what is Six Sigma.
Process Capability Analysis Assumptions
Before using a capability index to make decisions, it's worth checking whether the data actually support the calculation. A result can look precise on paper and still be misleading if the process or measurement method isn't suitable.
Three considerations are particularly important: normality, stability, and sample size.
Normality
Traditional Cp and Cpk calculations are most straightforward when process measurements follow an approximately normal distribution.
In a normal distribution, most measurements are clustered around the average, and there are fewer observations further away from the average.
Real-world data often do not adhere to this pattern. Measurements could be very skewed, have several groups or another distribution. In such cases, the normal capability indices may not reflect the true probability of making defects.
Histograms and normal probability plots are useful tools for teams to understand distributions. Formal statistical tests may provide additional information, but they should not be the only basis for deciding whether the data are appropriate.
If normality is not a reasonable assumption, a suitable non-normal capability method or other statistical technique may be more appropriate.
Stability
A stable process doesn't produce identical measurements every time. It produces variation that follows a reasonably consistent statistical pattern over time.
An unstable process may experience sudden shifts, trends, or other unusual changes. For instance, a machine might begin producing larger components as a cutting tool wears down. A change in raw material could also affect the dimensions of the finished product.
If these changes occur during the study, a single capability index may combine different operating conditions and give an unreliable picture of future performance.
Control charts help identify such changes. If instability appears, investigate the underlying causes before relying on conventional capability estimates.
It's important to remember that stability and capability aren't the same thing. A process can behave consistently and still fail to meet specifications because its variation is too large or its mean is poorly centered.
Adequate Sample Size
If you only measure a few products, you might miss some occasional variation or differences between operating conditions. This can lead to an unreliable estimate of standard deviation and hence an erroneous capability index.
The sample size required depends on the process, the sampling method, the confidence desired, and the statistical method. Sometimes thirty observations are used as a rule of thumb, but this number alone does not ensure a reliable analysis.
Measurements should be representative of the conditions that matter, including shifts, machines, and batches as appropriate.
The measurement system also deserves attention. If a gauge introduces excessive variation, the team may mistake measurement error for a process problem. A structured measurement system analysis helps establish whether the data are reliable enough to support meaningful conclusions.
Improving Process Capability
A low capability score is a reason to investigate, not simply a number to report. The next step is to understand what's driving the result.
Sometimes the process average is too close to one specification limit. In other cases, the process varies too much, even when its average is well positioned. Both problems can occur at the same time.
The DMAIC process gives teams a structured way to define the problem, measure current performance, investigate causes, test improvements, and maintain the results.
Center the Process
A process can have relatively little variation and still produce defects if its average is too close to one specification limit.
Consider a plastic component with specification limits of 19.5 mm and 20.5 mm. Its process mean is 20.1 mm, and its within-process standard deviation is 0.1 mm. As calculated earlier, its Cpk is 1.33.
Now suppose the team adjusts the process so that the mean moves to 20.0 mm while the standard deviation remains unchanged.
Cpu = (20.5 − 20.0) / (3 × 0.1) = 1.67
Cpl = (20.0 − 19.5) / (3 × 0.1) = 1.67
Cpk = 1.67
The process now has an equal margin on both sides of the target.
However, centring the process shouldn't become a numbers game. The team needs to understand why the mean was off-center and confirm that the adjustment won't introduce other quality problems.
Reduce Variation
Even when the process average is where it should be, excessive variation can push products outside the specification limits.
Reducing variation means finding the factors that make the process inconsistent. Depending on the situation, improvement actions may include:
- Standardizing machine settings and operating procedures.
- Scheduling preventive maintenance to reduce equipment-related variation.
- Improving raw material consistency and supplier quality.
- Training operators to follow consistent work methods.
- Monitoring environmental factors such as temperature and humidity.
- Investigating recurring defects through root cause analysis.
- Establishing a control plan in Six Sigma to sustain improvements.
For example, a packaging line might have inconsistent fill volumes due to pressure fluctuations, worn components, or uneven flow of material. So whenever you see a defect, you tweak the machine, but that does not necessarily mean that the defect will not come back.
If the team can identify the root cause, they are more likely to make a lasting improvement.
Once changes are made, collect new data, confirm process stability, and recalculate capability. This helps establish whether the improvement has genuinely reduced variation rather than producing a temporary improvement.
Process Capability in the Green Belt Exam
Process capability is one of the core Six Sigma Green Belt tools because it combines statistics with real-world quality improvement.
For the Green Belt exam, candidates should understand Cp, Cpk, Pp, and Ppk, know their formulas, and recognize the difference between specification limits and control limits.
You should also be able to explain why process stability is important and how the process mean affects Cpk and why Cpk and Ppk may yield different results.
Don’t just memorize formulas; this guide on how to pass the Lean Six Sigma Green Belt exam covers how to prepare for scenario questions too. Exam questions may ask you to interpret a capability number, determine the cause of a difference between indices, or explain why a stable process may still be incapable.
Candidates preparing for a Lean Six Sigma Green Belt certification can benefit from practicing both calculations and scenario-based questions. A Lean Six Sigma Green Belt practice test can help identify areas that need further revision.
Typical Exam Questions
1. A process has a USL of 100, an LSL of 80, and a within-process standard deviation of 2. What is Cp?
Cp = (100 − 80) / (6 × 2) = 20 / 12 = 1.67.
2. The process mean is 96. What is Cpk?
Cpu = (100 − recognize2) = 0.67.
Cpl = (96 − 80) / (3 × 2) = 2.67.
Cpk = min (0.67, 2.67) = 0.67.
3. Why might Ppk be lower than Cpk?
Ppk uses overall variation, which may include differences between shifts, batches, or operating conditions. When overall variation is greater than within-process variation, Ppk will generally be lower, assuming the same process mean and specification limits.
4. Can a stable process have a low Cpk?
Yes. Stability means the process behaves consistently, not that it meets specifications. A stable process can still produce too much variation or have an average that sits too close to one specification limit.
5. Which index considers process centering: Cp or Cpk?
Cpk considers process centering by measuring capability relative to both specification limits and selecting the smaller value. Cp compares specification width with within-process variation without considering the process mean.
Conclusion
Process capability helps teams understand whether their processes can meet quality requirements consistently. Instead of just using inspection results, it gives them a way to look at process variation and judge how much leeway they have before outputs go outside the acceptable range.
Cp and Cpk are measures of potential capability, based on within process variation, whereas Pp and Ppk are measures of performance, based on overall variation. Each index is a different view, and knowing the difference helps prevent misleading conclusions.
There’s more to it than just calculating Cpk. Teams also need to check stability, confirm that measurements are reliable, and ensure that data support the selection of the method.
If there is a lack of capability, the next step is to find out why. Better centering of the process, less variability, and fixing the same problems over and over can all help cut defects and make production more consistent.
Capability analysis is a part of the DMAIC process that moves organizations from fixing individual defects to building processes that reliably deliver results over time.








 Lowest-Price Challenge













 Personalized Path



.webp)


 USA
 Canada
 India
 UK
 Australia
 Singapore


