


 Call Us



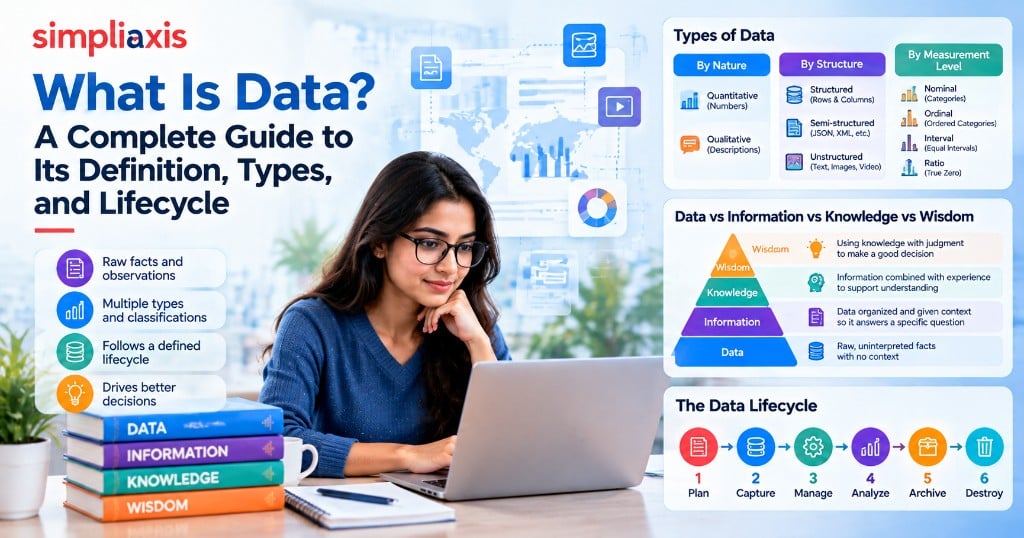
Data is any raw fact, observation, measurement, or symbol, whether a number, word, image, or signal, that has been recorded but not yet interpreted for meaning. On its own, a single data point such as "42" or "true" tells you nothing until it is placed in context, at which point it becomes information. Data is commonly classified along three independent dimensions: by nature (qualitative or quantitative), by structure (structured, semi-structured, or unstructured), and by measurement level (nominal, ordinal, interval, or ratio). Understanding these distinctions matters because the type of data you are working with determines which storage systems, statistical tests, and analytical tools can legitimately be applied to it.
Key Highlights: What Is Data?
- Data is raw and uninterpreted; it only becomes information once it is organized, given context, and made meaningful for a specific purpose.
- Every dataset can be classified along three separate axes at once: nature (qualitative vs quantitative), structure (structured, semi-structured, unstructured), and measurement level (nominal, ordinal, interval, ratio).
- According to IBM, unstructured formats such as documents, emails, images, and video account for roughly 80 to 90 percent of all data that organizations generate today.
- The data lifecycle typically runs through six stages: plan, capture, manage, analyze, archive, and destroy, and skipping governance at any stage degrades trust in the final analysis.
- IDC's widely cited "Data Age 2025" research, sponsored by Seagate, projected the global datasphere would reach 175 zettabytes annually by 2025, up from 33 zettabytes in 2018, a roughly 61 percent compound annual growth rate.
- Data quality is judged on dimensions such as accuracy, completeness, consistency, and timeliness; data that scores poorly on these dimensions produces unreliable analysis regardless of how sophisticated the technique applied to it is.
Definition of Data: What Data Actually Means
The word "data" comes from the Latin "datum," meaning "something given." In its most technical sense, data is a set of discrete, objective facts about events, entities, or observations, recorded as numbers, characters, symbols, images, or signals, before any interpretation has been applied. A temperature reading of 21, a customer's zip code, a pixel's color value, and the word "yes" typed into a survey field are all, individually, pieces of data.
What makes something "data" rather than "information" is the absence of context. A spreadsheet cell containing the number 4.9 is meaningless in isolation. It only becomes useful once you know it is a product rating out of 5, collected from 1,200 verified buyers, for a specific model, in a specific month. That act of adding context, structure and relevance is what data scientists and information theorists call turning data into information.
In computing specifically, data also refers to the values that a program stores, processes, and moves between memory and storage. Every data type in a programming or database context (integer, string, boolean, date, and so on) exists to tell the system how to store a value, what operations can be performed on it, and how much space it needs to occupy.
Data vs Information vs Knowledge (and Wisdom)
The relationship between data, information, knowledge, and wisdom is commonly described using the DIKW pyramid, a conceptual model used across library science, knowledge management, and data science to explain how raw facts become actionable judgment. Each layer adds something the layer below it lacks.
| Layer | Definition | Example |
| Data | Raw, uninterpreted facts or measurements with no context attached. | 68, 72, 75, 81, 79, said the thermometer. |
| Information | Data that has been organized, structured, or given context so it answers a specific question. | The average daily temperature this week was 75°F |
| Knowledge | Information combined with experience, analysis, or pattern recognition that supports understanding. | Temperatures rise steadily in the second half of the week, consistent with the approaching season |
| Wisdom | Using knowledge with judgment, foresight and context to make a good decision. | We should have the outdoor event Thursday, not Monday. |
We should have the outdoor event Thursday, not Monday.
The DIKW model is a simplification. Researchers have long been pointing out that the divisions between layers are not as sharp in reality as the pyramid suggests, and that knowledge and wisdom often evolve in non-linear, iterative processes rather than a strict upward movement. Even so, the framework remains useful as a mental model for a very practical reason: it explains why collecting more data does not automatically produce better decisions. An organization can accumulate terabytes of raw data and still make poor choices if that data is never converted into structured information, interpreted into knowledge, and applied with judgment.
Types of Data by Nature: Qualitative and Quantitative
The most fundamental way to classify data is by whether it can be counted and measured numerically, or whether it describes a quality, category, or characteristic.
Quantitative Data
Quantitative data is numerical. It responds to questions such as “how many,” “how much,” or “how often.” It performs arithmetic functions such as averaging, summing, and standard deviation calculation. Examples are a person’s age, monthly sales revenue, website session duration, and number of units produced on a factory line. Quantitative data is further split into discrete data (countable whole values, such as the number of support tickets filed) and continuous data (values that can take any measurement within a range, such as weight or elapsed time).
Data - Qualitative data
Qualitative data is descriptive in nature, not quantitative. It comprises features, classes, opinions or qualities that cannot be added or averaged in any meaningful manner, even where the classes are represented by numbers or codes. Examples include a customer’s favorite color, a free-text product review, a patient’s blood type, or a satisfaction rating of “dissatisfied” vs. “satisfied.” Qualitative data is typically analyzed through categorization, thematic coding, or frequency counts rather than arithmetic.
Most real datasets mix both types. A single customer record might hold quantitative fields (purchase amount, number of visits) alongside qualitative fields (preferred category, membership tier), and analysts routinely convert one into the other, for example by bucketing a continuous age variable into ordinal age bands. Teams pursuing formal training in this distinction, and in how it feeds downstream statistical analysis, often build on it in a broader data science certification course that covers exploratory data analysis in depth.
Types of Data by Structure: Structured, Semi-Structured, and Unstructured
A second, independent way to classify data is by how organized its format is, which in turn determines what kind of database or storage system can hold it efficiently.
Structured Data
Structured data conforms to a fixed, predefined schema, typically rows and columns, such as those found in a relational database or a spreadsheet. Every record follows the same field definitions, which makes structured data straightforward to search, filter, and query using SQL. Examples include transaction records, inventory tables, payroll data, and CRM contact fields.
Semi-Structured Data
Semi-structured data, while not easily fitting into rows and columns, does contain organizational marks, such as tags, keys or hierarchies, that allow it to be parsed programmatically. The common formats are JSON , XML , YAML configuration files and email ( email has structured headers like sender and timestamp , but an unstructured message body ) .
Unstructured Data
Unstructured data doesn’t have a defined format or organization. It includes free-text documents, PDFs, audio recordings, video files, social media posts and images. In the past, searching and analyzing unstructured data could not be done with a standard database query, but required specialized tools, such as natural language processing or computer vision, because there was no fixed schema.
According to IBM's overview of structured versus unstructured data, unstructured formats now make up an estimated 80 to 90 percent of all data generated by organizations, a share that keeps climbing as more communication, media, and IoT sensor output is captured digitally.
Types of Data by Measurement Level: Nominal, Ordinal, Interval, and Ratio
Statisticians use a third classification, the level of measurement, to determine which statistical tests and operations are mathematically valid for a given variable. Each level builds on the one before it, adding a new property.
- Nominal: Categorizes data into named labels with no inherent order or numeric value. Examples: blood type, hair color, country of residence.
- Ordinal: Categorizes data into labels with a meaningful order, but without a consistent, measurable distance between categories. Examples: a satisfaction scale (poor, fair, good, excellent), education level, or a race's finishing positions (1st, 2nd, 3rd).
- Interval: Numeric data with a consistent, meaningful distance between values, but no true zero point, meaning ratios between values are not meaningful. Example: temperature in Celsius or Fahrenheit, where 0 degrees does not mean "no temperature."
- Ratio: Numeric data with a consistent interval and a true, meaningful zero point, which makes ratios between values valid. Examples: weight, height, income, and time elapsed, where 20 kilograms is genuinely twice as heavy as 10 kilograms.
This distinction is not academic trivia. Applying the wrong statistical test to the wrong measurement level, for instance calculating a mean on ordinal survey data as though it were ratio data, is one of the most common analytical errors in business reporting, and it can quietly produce misleading averages and correlations.
Data Type Comparison Table
| Classification | Categories | Key Question It Answers | Typical Example | Common Tools |
| By nature | Qualitative, Quantitative | Is it a number or a description? | Product review text vs. sales figure | Text coding tools vs. spreadsheets, statistical software |
| By structure | Structured, Semi-structured, Unstructured | Does it fit a fixed schema? | SQL table vs. JSON file vs. video | Relational databases, NoSQL/document stores, data lakes |
| By measurement level | Nominal, Ordinal, Interval, Ratio | What operations are mathematically valid on it? | Blood type vs. survey rating vs. temperature vs. income | Statistical packages, BI and visualization tools |
Where Data Comes From: Primary and Secondary Sources
Data is also categorized according to its source. Primary data are gathered firsthand for a particular purpose, via surveys, interviews, sensor readings, experiments or direct observation. Secondary data is data that already exists, having been collected by someone else for a different original purpose, and is reused, such as government census records, published research, or third-party market reports.
Today’s organizations have access to additional data sources, including internal transactional systems (point-of-sale systems, ERP systems), external and open data (government data portals, industry benchmarks), machine-generated data (IoT sensors, application logs, clickstreams), and human-generated data (social media activity, survey responses, support tickets). Teams that need a structured framework for planning firsthand data collection, choosing between primary and secondary sources, and avoiding common sampling bias can review the deeper walkthrough in this guide to data collection methods and process.
The Data Lifecycle: From Creation to Deletion
Data does not simply sit still once it is captured; it moves through a defined lifecycle, and treating each stage deliberately is central to good data governance. The lifecycle is commonly described in six phases.
- Plan: Before you start collecting anything, define what data you need, why you need it, who owns it, and how you will govern it.
- Capture: Acquire or collect data from a primary or secondary source, such as a form, sensor, transaction, or external feed.
- Manage: Store, clean, validate and maintain the data, including decisions about where it lives and who can access it.
- Analyze: Turn the data into information and insight through the use of statistical, business intelligence or machine learning methods.
- Archive: Retain data that is no longer actively used, but still needed for compliance, audit or historical reasons.
- Destroy: Permanently and securely delete data and any redundant copies when it no longer has any legal, business or historical value.
Organizations that build careers or teams around this lifecycle, particularly in business intelligence and reporting roles, often formalize the "manage" and "analyze" stages using dedicated platforms; professionals moving into these roles frequently pursue tools-based credentials such as a Microsoft Power BI certification to operationalize the analysis stage of this lifecycle at scale.
Data Quality: What Makes Data Trustworthy
Not all data is equally trustworthy, and analysis built on poor-quality data produces poor-quality conclusions regardless of how advanced the analytical method is. Data quality is generally assessed across a handful of core dimensions.
- Accuracy: The degree to which data correctly reflects the real-world value or event it represents.
- Completeness: Whether all the data intended for collection was actually captured, with no missing critical fields.
- Consistency: Whether the same data value matches across every system and record where it appears.
- Timeliness: Whether the data is current and available when it is actually needed for a decision.
- Uniqueness: Whether each real-world entity or event is represented once, without duplicate records distorting counts.
- Validity: Whether data conforms to the required format, type, and range defined for that field.
These dimensions matter to any role that turns data into decisions, which is why analysts working across the raw data, business analyst, and data analyst career paths spend a meaningful share of their time on validation and cleaning before analysis ever begins.
How Much Data Exists: Global Data Volume and Growth
The scale of global data creation has grown so quickly that the industry now measures it in zettabytes, a unit equal to one trillion gigabytes. IDC's "Data Age 2025" research, commissioned with sponsorship from Seagate, forecast that the Global DataSphere, IDC's term for the total amount of data created, captured, and replicated worldwide each year, would reach approximately 175 zettabytes by 2025, up from about 33 zettabytes in 2018, representing a compound annual growth rate of roughly 61 percent. More recent IDC forecasting has projected the figure to climb further, toward the range of 290 to 300 zettabytes by 2027 to 2028, driven heavily by IoT device output, video, and increasingly by data generated for and by artificial intelligence systems.
A large and growing share of this data is unstructured. As noted above, IBM estimates that 80 to 90 percent of enterprise-generated data today is unstructured, sitting in documents, emails, images, audio, and video rather than in traditional relational tables. That shift is a major reason data lakes, vector databases, and AI-driven document processing have become central to modern data architecture, alongside the relational databases that still anchor structured transactional systems.
Why Data Matters in Business, Analytics, and Careers
Understanding what data is, and how to classify it correctly, is the foundation for every downstream analytical discipline: business intelligence, data science, machine learning, and process improvement methodologies such as Six Sigma all depend on correctly identifying the type of data at hand before choosing an analytical method. Applying a mean and standard deviation to ordinal survey data, or trying to run a relational query against unstructured video, are both classic errors that trace directly back to skipping this classification step.
This foundational knowledge underpins entire career tracks. Professionals moving into data-heavy roles typically build from these fundamentals into structured statistical and programming training, most commonly through a broader data science certification that covers data types, cleaning, exploratory analysis, and modeling in sequence, or through business-analyst-track courses that emphasize data-driven requirements gathering and reporting over machine learning.









 Lowest-Price Challenge











 Personalized Path


.webp)


 USA
USA  Canada
 India
India UK
UK Australia
 Singapore


