


 Call Us




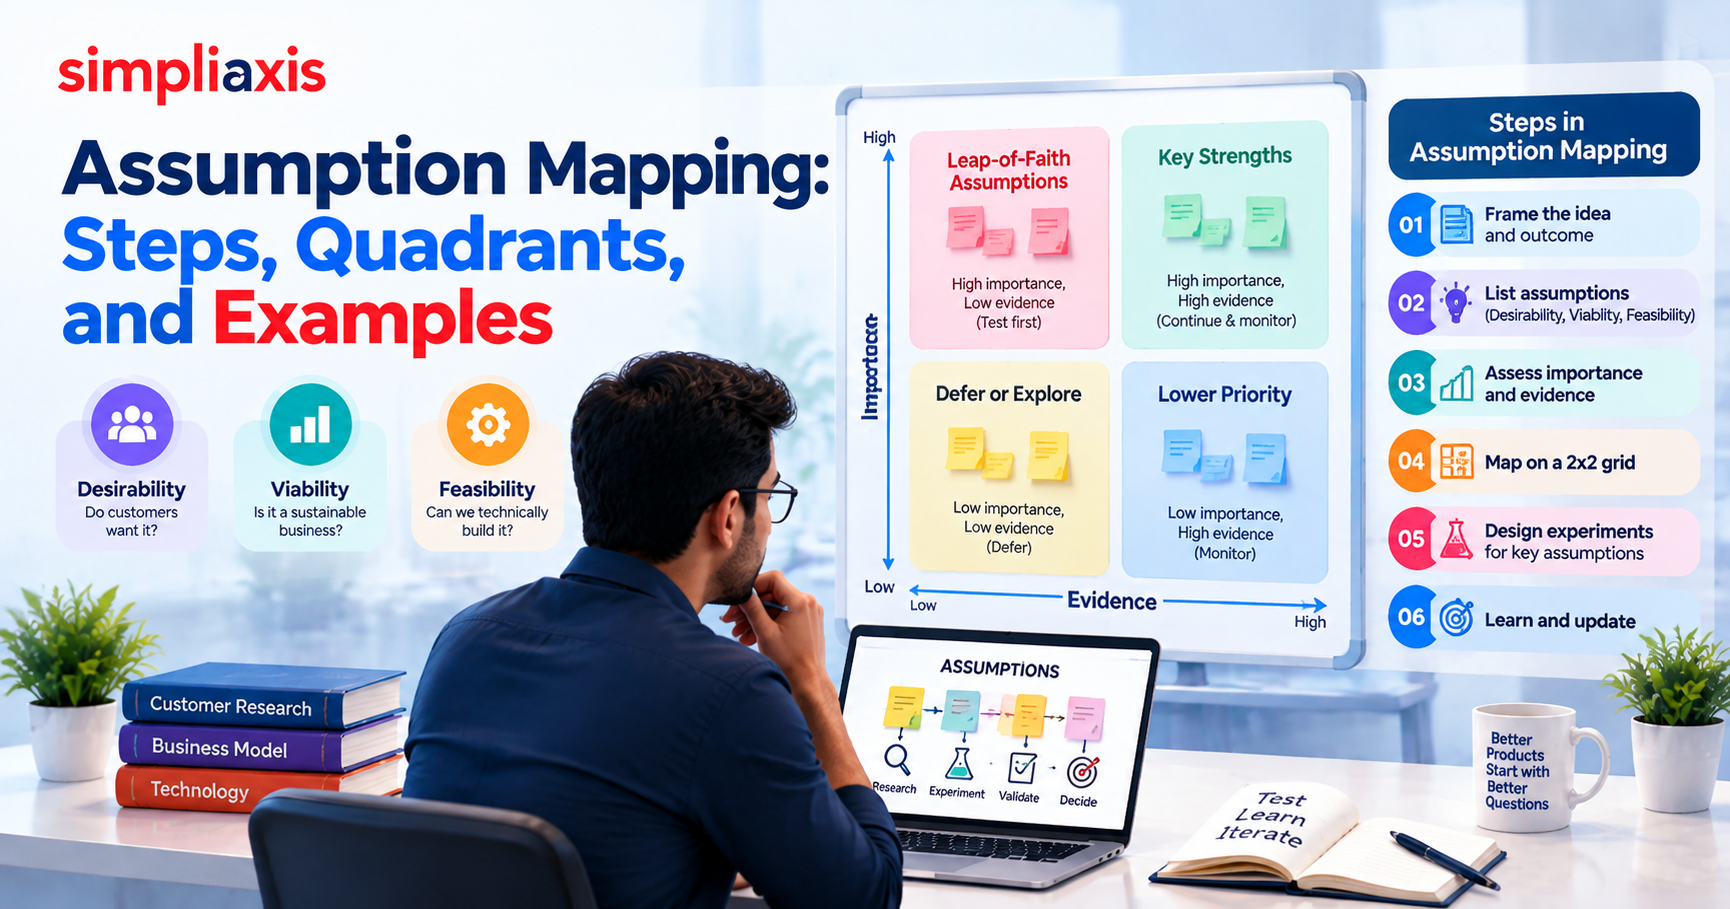
Assumption mapping is a product discovery technique that helps teams discover the underlying beliefs of a product idea, determine how important those beliefs are, and understand the evidence behind those beliefs.
The method usually ranks assumptions by desirability, viability, and feasibility and then maps them on a 2x2 grid based on importance and evidence. The most important assumptions are usually high in importance but low in evidence. These are often called “leap-of-faith” assumptions because they are very product- or business-dependent and have little proof.
Key Highlights of Assumption Mapping
Assumption mapping makes hidden product, customer, business, and technology beliefs visible.
The three core assumption categories are desirability, viability, and feasibility.
The importance vs. evidence 2x2 allows teams to prioritize assumptions objectively.
High-importance, low-evidence assumptions are usually preferred for testing.
A good assumption mapping framework connects assumptions directly to experiments and decisions.
Customer interviews, prototypes, pricing tests, technical spikes, landing pages, and behavioral data offer required evidence.
Assumption mapping works particularly well within product discovery, Lean UX, Agile, and experimentation practices.
It should be revisited as customer research, technical findings, market conditions, or business priorities change.
CB Insights' analysis of more than 100 startup failure post-mortems identified lack of market need among the leading reported reasons for failure; its widely cited 2018 analysis put “no market need” at 42% of the sample. This is historical post-mortem data, not a general failure probability.
Introduction
A great product idea can still fail if the assumptions behind it are wrong. Customers may not want the solution, the business model may not be sustainable, or the technology may be harder to build than expected.
Assumption mapping is a technique to assist product teams in discovering those hidden beliefs, stepping back and assessing the importance of those beliefs, and identifying which beliefs need evidence first. Mapping assumptions across desirability, viability, and feasibility allows teams to focus their product discovery efforts on the uncertainties that will have the biggest impact and test them before they invest heavily in development.
What Is Assumption Mapping?
Definition and Origins in Lean UX
Assumption mapping is a structured team exercise in which desirability, viability, and feasibility hypotheses are made explicit and prioritized according to importance and evidence. The approach is associated with Lean UX and was later developed into a practical experimentation method for product and business teams. The underlying idea is straightforward: every product decision contains assumptions.
A team might say:
“Customers will use this feature.”
But unless customers have demonstrated that behavior, the statement is a belief rather than a fact.
In Lean UX these beliefs are seen as hypotheses that can be explored through research, prototypes, experiments, and customer feedback, a core principle ofAgile product development. This allows teams to learn fast, rather than treating early requirements as set in stone. For example, a company is building an AI-driven expense management platform. The team might think that:
Finance teams want transactions automatically categorized
Employees will link their corporate cards.
The AI is able to correctly classify transactions.
The service will be paid for by companies.
Instead of immediately building the full product, the team can use an assumption mapping technique to determine which of these beliefs are most important and least supported by evidence. That turns assumption mapping from a diagramming exercise into a practical decision-making tool.
How It Differs From a Risk Register or Brainstorm
Assumption mapping overlaps with project risk management, but it answers a different question. A risk registermight say:
Risk | Probability | Impact | Mitigation |
API integration takes longer than expected | Medium | High | Technical spike |
Adoption is lower than expected | High | High | Customer research |
A competitor launches a similar feature | Medium | Medium | Competitive monitoring |
An assumption map goes deeper by identifying the belief behind the risk.
Instead of:
“Adoption could be low.”
The team might write:
“At least 25% of our target customers will consider automated reconciliation valuable enough to try.”
That statement can be investigated with atechnical spike or prototype.
A brainstorming session, meanwhile, is primarily about generating ideas. Assumption mapping takes those ideas and asks:
What must be true for this idea to work?
This makes the exercise particularly useful when a team needs to move from broad ideation into focused validation.
The Idea of Leap-of-Faith Assumptions
A leap-of-faith assumption is an assumption that is highly important to the success of an idea but has little supporting evidence.
For example:
“Independent retailers will pay $100 per month for AI-powered demand forecasting.”
If the entire business model depends on this pricing assumption and the team has never tested willingness to pay, it represents a significant uncertainty.
Calling it a leap-of-faith assumption does not mean it is wrong. It means the team is relying on it without enough evidence.
This distinction is important. Assumption mapping is not about labelling ideas as good or bad. It is about identifying where uncertainty could materially affect a decision.
The 3 Types of Assumptions
Desirability: Do Customers Want It?
Desirability assumptions concern customers and users.
They ask whether:
The problem exists.
The problem is important enough to solve.
Customers recognize the problem.
The proposed solution addresses the problem.
Users will adopt the solution.
Customers are willing to change existing behavior.
For example:
“Small-business owners spend enough time creating financial reports that they would consider automated reporting valuable.”
This is a desirability assumption.
Customer interviews, usability testing, prototype testing, behavioral data, and observation can provide evidence.
Desirability deserves particular attention because teams can easily confuse internal enthusiasm with customer demand. A product team may believe a feature is valuable because stakeholders repeatedly request it, while customers may have a different priority.
Historical startup data reinforces why market needs deserve explicit investigation. CB Insights' analysis of startup post-mortems identified “no market need” as the most frequently cited reason in its 2018 analysis, appearing in42% of the failures examined, CB Insights
Viability: Can We Build a Sustainable Business
Viability assumptions concern whether an idea can work economically.
Typical viability assumptions include:
Customers will pay for the product.
The price is acceptable to the target market.
Customer acquisition costs can be supported by revenue.
Customers will remain long enough to generate sustainable value.
The target market is large enough.
Operating costs will not exceed the available revenue opportunity.
Consider:
“Mid-sized agencies will pay $50 per month for automated client reporting.”
This is not established simply because another software company charges $50. The actual willingness to pay depends on the target customer, problem, alternatives, perceived value, and purchasing process.
Useful viability tests can include pricing interviews, sales conversations, pre-orders, landing-page experiments, pilot programs, and analysis of existing customer behavior.
Feasibility: Can We Technically Build It
Feasibility assumptions are primarily related to technology, operations, resources, integrations, data, security, and delivery.
Examples include:
The required API offers the necessary data.
Existing infrastructure can support the expected workload.
An AI model can achieve an acceptable accuracy level.
The engineering team can provide the solution within the expected timeframe.
Regulatory or security requirements can be met.
Third-party dependencies will remain available.
A feasibility assumption should be specific enough to test.
Instead of:
“The technology will work.”
Use:
“The existing payment API can return the transaction fields required for automated reconciliation.”
That statement can be investigated with a technical spike or prototype.
The Assumption Mapping 2x2 Explained
The Two Axes: Importance and Evidence
The standard assumption mapping canvas uses two dimensions:
Importance: How much would the product or business be affected if the assumption were wrong?
Evidence: How much credible evidence currently supports the assumption?
These dimensions produce a simple 2x2 grid.
The important distinction is that importance and evidence are not the same thing.
An assumption can be extremely important but well supported. Another can be relatively unimportant and completely untested.
The map helps teams avoid spending equal effort on both.
The Four Quadrants and What They Mean
Quadrant | Importance | Evidence | Typical action |
High importance / Low evidence | High | Low | Test first |
High importance / High evidence | High | High | Continue and monitor |
Low importance / Low evidence | Low | Low | Defer or monitor |
Low importance / High evidence | Low | High | Usually deprioritize |
The labels are less important than the discussion they create. If one stakeholder believes an assumption is highly important and another believes it has little impact, that disagreement is valuable. It may reveal a strategic question that needs clarification.
Why the High-Importance, Low-Evidence Quadrant Wins Focus
The high-importance, low-evidence quadrant contains the assumptions most likely to create expensive surprises.
Suppose a team has these three assumptions:
Customers prefer a blue button over a green button.
Customers have a serious problem with manual reporting.
The required accounting integration is technically possible.
The first may be worth testing eventually, but it is unlikely to determine whether the product concept works.
The second and third could fundamentally change the product direction.
This is why the core principle of assumption mapping is
Test what matters most, not merely what is easiest to test.
Strategyzer's guidance also uses assumption mapping to focus experimentation on high-risk areas instead of doing convenient experiments that do not address the strategy's most important uncertainties.
How to Run an Assumption Mapping Workshop Step by Step?
Step 1: Frame the Idea, Customer, and Outcome
Start by establishing the context.
Capture:
- Target customer profile
- Problem or opportunity.
- Suggested solution
- Customer impact
- Financial outcome
For example:
Customer: Online independent retailers
Problem: Inventory decisions require high manual effort
Solution: AI-based demand forecasting
Customer outcome: Reduction in stockouts and forecasting time
Business outcome: Grow recurring subscription revenue
This framing keeps the assumption mapping workshop on track
You can also do a stakeholder analysis in advance to find out the buyers, users, influencers, internal stakeholders, and other groups whose assumptions may affect the product.
Step 2: Assumptions for the Three Brainstorming Types
Consult the team:
“What has to be true for this idea to work?”
One assumption for every card or note.
For the inventory example:
Desirability
- Stockouts occur frequently for retailers
Current forecasting tools are difficult to use.
Retailers trust automated recommendations.
Viability
Retailers will pay $50 per month.
Subscription revenue can support acquisition costs.
The addressable segment is sufficiently large.
Feasibility
Required sales data is accessible.
Forecast accuracy can reach an acceptable level.
Existing infrastructure can handle demand.
A cross-functional group usually produces a stronger assumption set because different roles see different uncertainties.
Step 3: Rank Each by Importance and Evidence
Check every assumption and ask:
If this is wrong, how seriously does it affect our idea?
Then ask:
How much credible evidence do we currently have?
Use simple categories such as low, medium, and high.
Evidence might come from:
Customer interviews
Behavioral analytics
Sales data
Existing product usage
Technical prototypes
Historical performance
Market research
Usability tests
An opinion from a senior stakeholder can inform the discussion, but it should not automatically be treated as customer evidence.
Step 4: Plot and Identify Leap-of-Faith Assumptions
Put each assumption on the 2X2 grid.
The main leap-of-faith assumptions are those in the high-importance, low-evidence quadrant.
For instance:
“AI forecasting will be costing at least 20% of target retailers $50 per month.”
If that assumption underpins the business model and there is no evidence on pricing, it should be an early research priority.
Step 5: Design Experiments for the Riskiest Assumptions
The next question is
“What is the smallest credible experiment that could offer useful evidence?”
Examples:
Desirability → customer interviews or prototype testing.
Viability → pricing research or sales conversations.
Feasibility → technical spike or integration prototype.
Adoption → landing page or smoke test.
Workflow usability → moderated usability test.
The goal is not to build a smaller version of the final product. The goal is to obtain useful evidence with as little unnecessary investment as possible.
Assumption Mapping Example (Worked)
Imagine a SaaS company wants to build an AI assistant that automatically prepares weekly reports for small marketing agencies.
The team identifies these assumptions:
Assumption | Type | Importance | Evidence |
Agency owners spend substantial time preparing reports | Desirability | High | Low |
Owners want automated reporting | Desirability | High | Low |
Owners will pay $40/month | Viability | High | Low |
Required data can be retrieved through APIs | Feasibility | High | Medium |
AI can generate acceptable summaries | Feasibility | High | Medium |
Users prefer weekly email delivery | Desirability | Low | Low |
Existing cloud infrastructure can support the service | Feasibility | Medium | High |
The team now has a clear testing sequence.
Test 1: Problem validation
Interview existing agency owners about their reporting process. The goal is to explore the workflow, time spent, frustrations, workarounds, and consequences.
Test 2: Concept validation
Let potential users see a lightweight prototype. Check if the suggested workflow solves a problem they already know about.
Test 3: Pricing validation
Discuss pricing with qualified prospects and investigate current alternatives, budgets, purchasing authority, and willingness to participate in a paid pilot.
Suppose the research reveals that reporting is time-consuming, but agency owners consider client communication a much bigger problem. That is useful evidence. The team could change the value proposition, target another segment, redesign the product, or stop pursuing the original concept. No full product was required to discover the problem.
From Assumptions to Experiments
Matching Test Types to Assumption Types
Different assumptions require different experiments.
Assumption | Suitable test |
Customers have the problem | Customer interviews |
Customers value the solution | Concept test |
Customers understand the workflow | Prototype test |
Customers will use the feature | Usability or behavioral test |
Customers will pay | Pricing or sales experiment |
Customers will sign up | Landing page or smoke test |
Technology can support the idea | Technical spike |
Integration works | API prototype |
AI output is accurate enough | Evaluation dataset and prototype |
A common mistake is using one research method for every type of assumption. For example, customer interviews may help establish that a problem exists, but they cannot by themselves prove that an API can handle the required transaction volume.
Setting a Clear Pass or Fail Criterion
Define the decision rule before running the experiment.
For example:
“We will consider the desirability assumption supported if at least 6 of 8 target customers independently describe the reporting problem as significant and express interest in evaluating the proposed workflow.”
The exact threshold should depend on the decision, sample, market, and consequences of being wrong.
A useful experiment therefore defines:
The assumption
The test method
The evidence require
The decision criterion
This keeps the team from changing the definition of success after seeing the results.
Deciding to Persevere, Pivot, or Stop
An experiment generally leads to one of three outcomes.
Supported: The evidence meets the predefined criterion. Continue while recognizing that the assumption may still contain uncertainty.
Not supported: The evidence contradicts the assumption. Change the product direction, customer segment, value proposition, business model, or solution—or stop.
Inconclusive: The test did not provide reliable evidence. Improve the experiment rather than forcing a conclusion.
A failed hypothesis is not necessarily wasted work. If it prevents months of development based on a false belief, the experiment has produced valuable learning.
Assumption Mapping in Continuous Discovery
How Assumption Tests Fit on an Opportunity Solution Tree?
An opportunity solution tree connects an outcome to customer opportunities and potential solutions.
Assumption mapping can complement this structure.
For example:
Outcome: Improve the number of successful onboarding
→ Opportunity: New users fail to cope with the setup
→ Solution: Guided onboarding checklist
→ Assumptions:
Users genuinely struggle with setup.
The checklist helps by addressing the problem.
Users will follow the checklist.
Required information can be surfaced automatically.
TheProduct Discoveryprocess can then use experiments to test those assumptions before the solution receives significant development investment.
The distinction is useful:
Opportunity solution trees show where you are exploring.
Assumption mapping shows what needs to be true.
Keeping a Living Assumptions Backlog
An assumptions backlog should evolve as the team learns.
A practical structure is
Field | Purpose |
Assumption | What the team believes |
Type | Desirability, viability, feasibility |
Importance | Consequence if wrong |
Evidence | Current level of support |
Experiment | Planned test |
Result | What was learned |
Decision | Keep, change, or remove |
Review the backlog whenever new research or significant product decisions occur.
A new customer segment may create new desirability assumptions. A pricing change may create new viability assumptions. A new technical architecture may introduce feasibility assumptions.
This is what makes assumption mapping a continuous practice rather than a one-time workshop.
Assumption Mapping vs. Related Techniques
Assumption Mapping vs. Impact Mapping
Assumption mapping and impact mapping can complement each other, but their purposes differ.
Dimension | Assumption Mapping | Impact Mapping |
Primary purpose | Identify and prioritize uncertainty | Connect work to desired outcomes |
Core question | What must be true? | What can influence the outcome? |
Main structure | Importance/evidence 2x2 | Goal → actors → impacts → deliverables |
Main focus | Evidence and risk | Behavior and outcomes |
Typical output | Prioritized assumptions and experiments | Impact-oriented map |
Best use | Deciding what to test | Planning how an outcome might be achieved |
For example, impact mapping may show that increasing repeat purchases requires customers to discover more relevant products.
Assumption mapping can then ask:
“Do customers actually struggle to discover relevant products?”
and:
“Will personalized recommendations increase repeat purchases?”
The two techniques therefore address different parts of the discovery problem.
Assumption Mapping vs. the Business Model Canvas
The Business Model Canvas provides a broad picture of how a business creates, delivers, and captures value.
Dimension | Assumption Mapping | Business Model Canvas |
Primary purpose | Prioritize assumptions | Visualize the business model |
Focus | Uncertainty and evidence | Business model components |
Typical elements | Desirability, viability, feasibility | Customers, channels, revenue, costs, partners |
Main output | Experiment priorities | Business model overview |
Key question | What could make this idea wrong? | How does this business work? |
A Business Model Canvas can generate dozens of assumptions. Assumption mapping helps determine which of those assumptions deserve immediate validation.
How Stakeholder and Customer Journey Mapping Feed In?
Mapping techniques like stakeholder mapping and customer journey mapping provide valuable inputs to an assumption map. For instance:
Stakeholder mapping helps in identifying who buys, uses, influences, supports, or can block a product. On the contrary, customer journey mapping highlights customer behaviors, pain points, expectations, and moments of friction.
For example, a customer journey map might show that users frequently discard an onboarding process during identity verification. The team could convert this observation into assumptions:
“Identity verification is one of the prime contributors to onboarding abandonment.”
“Minimizing verification on friction will increase completed registrations.”
This creates a useful sequence as follows:
Observe → identify opportunity → formulate assumption → test → learn → update.
Common Mistakes to Avoid
Confusing Facts With Assumptions
Statements such as “customers need this” or “engineering can build this” are often treated as facts.
Ask:
“What evidence supports this statement?”
“What evidence supports this statement?”
If the answer is based mainly on opinion, intuition, limited anecdotes, or internal expectations, it may still be an assumption. Similarly, UX research guidance warns that it is easy to confuse assumptions with facts and recommends testing key assumptions with evidence and validation.
Over-Focusing on Feasibility, Ignoring Desirability
Technical teams naturally spend more time on feasibility, as technical constraints can be concrete and familiar. But a technically impressive product can still fail to solve a meaningful customer problem.
Make sure the map includes assumptions about:
Customer need
Customer behavior
Value perception
Adoption
Switching behavior
Willingness to pay
Product discovery is intended to explore unknowns across customers, the business, and technology, with desirability, viability, and feasibility considered together.
Mapping Once and Never Revisiting
An assumption map is not a permanent artifact. Customer behavior changes. New evidence appears. Technology evolves. Likewise, competitors come to the market, pricing differs, and business priorities also change. Therefore,
Review the map when:
If this is wrong, how seriously does it affect our idea?
How much credible evidence do we currently have?
Use simple categories like low, medium, and high.
Evidence might come from:
Customer interviews
Behavioral analytics
Sales data
Existing product usage
Technical prototypes
Historical performance
Market research
Usability tests
Step 4: Plot and Identify Leap-of-Faith Assumptions
“At least 20% of target retailers will pay $50 per month for AI forecasting.”
Step 5: Design Experiments for the Riskiest Assumptions
“What is the smallest credible experiment that could provide useful evidence?”
Examples:
Desirability → customer interviews or prototype testing.
Viability → pricing research or sales conversations.
Feasibility → technical spike or integration prototype.
Adoption → landing page or smoke test.
Workflow usability → moderated usability test.
Assumption Mapping Example (Worked)
Assumption | Type | Importance | Evidence |
Agency owners spend substantial time preparing reports | Desirability | High | Low |
Owners want automated reporting | Desirability | High | Low |
Owners will pay $40/month | Viability | High | Low |
Required data can be retrieved through APIs | Feasibility | High | Medium |
AI can generate acceptable summaries | Feasibility | High | Medium |
Users prefer weekly email delivery | Desirability | Low | Low |
Existing cloud infrastructure can support the service | Feasibility | Medium | High |
Show a lightweight prototype to potential users. Observe whether the proposed workflow addresses a problem they already recognize.
From Assumptions to Experiments
Matching Test Types to Assumption Types
Assumption | Suitable Test |
Customers have the problem | Customer interviews |
Customers value the solution | Concept test |
Customers understand the workflow | Prototype test |
Customers will use the feature | Usability or behavioral test |
Customers will pay | Pricing or sales experiment |
Customers will sign up | Landing-page or smoke test |
Technology can support the idea | Technical spike |
Integration works | API prototype |
AI output is accurate enough | Evaluation dataset and prototype |
Define the decision rule before running the experiment.
“We will consider the desirability assumption supported if at least 6 of 8 target customers independently describe the reporting problem as significant and express interest in evaluating the proposed workflow.”
The exact threshold should depend on the decision, sample, market, and consequences of being wrong.
A useful experiment therefore defines:
Over-Focusing on Feasibility, Ignoring Desirability
Technical teams naturally spend time on feasibility because technical constraints can be concrete and familiar.
New research becomes available.
A major feature is proposed.
A customer segment changes
Pricing changes.
A technical architecture changes.
An experiment produces unexpected results.
A major product decision is being made.
The objective is to maintain an accurate picture of uncertainty.
Assumption Mapping for SAFe Product Owners and Managers
For SAFe Product Owners and Product Managers, whoseroles and responsibilities include defining and validating features, assumption mapping can provide a structured way to make uncertainty visible before committing significant development capacity. A product decision may involve customer needs, technical dependencies, business economics, compliance, stakeholders, and delivery constraints. An assumption map gives these different concerns a common language.
For example, consider an automated invoice-matching feature.
Desirability assumption: Finance teams have enough manual reconciliation work that they would want automation.
Assumption of viability: The reduction in manual effort creates sufficient value to justify the proposed price.
Feasibility assumption: Existing invoice and transaction data is sufficiently well structured for automatching.
Each assumption can be investigated independently before the team commits to a large implementation.
This approach also fits well with scaled product development because it encourages teams to distinguish what they know from what they believe.
For professionals developing product owner or product manager skills,SAFe POPM Certification Training provides additional training around product responsibilities within the SAFe framework.
Best Practices for Assumption Mapping
A successful assumption mapping workshop should produce decisions, not just sticky notes.
Here are some of the best practices:
Start with the outcome: Define the customer or business change you want to create.
Make assumptions specific: “Market risk” is too vague; “customers will pay $50 per month” is testable.
Use a cross-functional team: Product, design, engineering, research, sales, and operations can identify different risks.
Separate importance from evidence: A critical assumption may already have strong evidence.
Prioritize consequences: Ask what happens if the assumption is wrong.
Use behavioral evidence where possible: What customers do can be more informative than what they say they might do.
Test the riskiest assumptions first: Do not simply choose the easiest experiments.
Keep experiments small: The goal is evidence, not a miniature version of the finished product.
Define success criteria in advance: This reduces confirmation bias.
Record the result: Connect every experiment back to the original assumption.
Update the map: Evidence should change the understanding of the enterprise team.
Use tools that support collaboration: Use whiteboards, spreadsheets, documentation platforms, and research repositories as the most appropriate assumption mapping tools.
A simple assumption mapping template can feature four sections:
1. Product context
Customer + problem + desired outcome
2. Assumptions
Desirability + viability + feasibility
3. 2x2 map
Importance × evidence
4. Experiments
Assumption + test + success criterion + decision
Teams usingUser Story Mapping can also combine the techniques. User story mapping organizes the customer's activities and product functionality, while assumption mapping highlights the uncertainties behind important product decisions.
Conclusion
Assumption mapping gives product teams a practical way to deal with uncertainty before that uncertainty becomes expensive. Instead of assuming that customers want a product, that the business model will work, or that the technology is straightforward, teams can make those beliefs explicit and test the ones that matter most.
The process is simple:
Frame the idea → identify assumptions → classify them → assess importance and evidence → identify leap-of-faith assumptions → design experiments → learn → update.
The value is not the 2x2 diagram itself. The real value is the change in how teams make decisions. Rather than asking:
“What should we build next?”
Teams can ask:
“What needs to be true for this idea to work, and what is the fastest credible way to find out?”
That makes assumption mapping a useful part of modern product discovery. It connects customer research, business validation, technical investigation, experimentation, and product strategy.
The strongest assumption mapping process is therefore not a one-time workshop. It is a continuous habit of making uncertainty visible, testing important beliefs, learning from evidence, and adjusting the product direction accordingly.








 Lowest-Price Challenge













 Personalized Path






 USA
 Canada
 India
 UK
 Australia
 Singapore


