


 Call Us



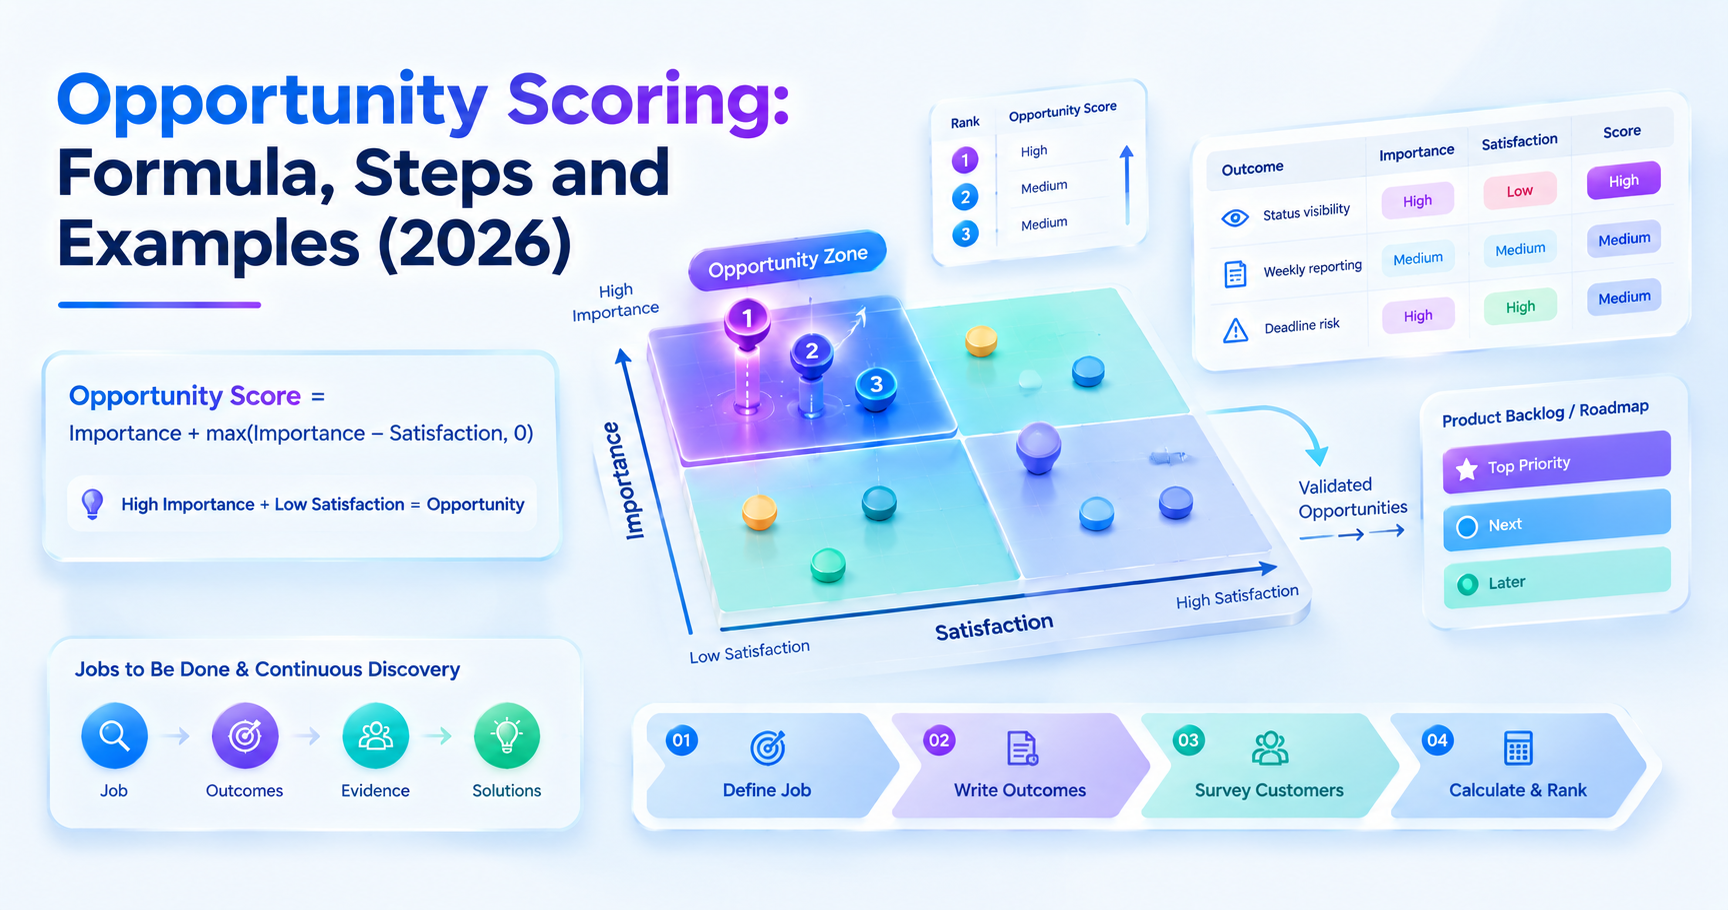
Opportunity scoring is a customer-research method that ranks needs by how important they are and how poorly they are served today. The formula is Importance + max (Importance - Satisfaction, 0). Outcomes with high importance and low satisfaction score highest. They become your strongest candidates for the next roadmap investment.
Key Highlights of Opportunity Scoring
- Opportunity scoring ranks customer outcomes on two dimensions: importance and satisfaction.
- The method comes from Tony Ulwick's Outcome-Driven Innovation (ODI) approach.
- The opportunity score formula is Importance + max(Importance − Satisfaction, 0).
- The formula gives importance double weight compared with a simple gap analysis.
- A typical opportunity scoring survey has four steps: define the job, write outcome statements, survey customers, and calculate scores.
- The method fits naturally with Jobs to Be Done and continuous discovery.
- Scores are directional. Pair them with interviews, effort estimates, and strategy.
- Use it with RICE, not instead of it, when you need to balance customer needs against delivery cost.
Introduction
Every product team faces the same problem. There are more ideas than capacity, and theproduct backlog keeps growing. Stakeholders push favorite features. Customers request different things. Sales adds urgent tasks. Without a clear method, the loudest voice wins.
Opportunity scoring offers a better path. It asks customers two simple questions about each need.
- How important is it?
- How satisfied are you today?
The answers reveal where real gaps exist.
This guide explains opportunity scoring in plain terms. You will learn the formula, the survey steps, and a worked example. You will also see how the method connects to Jobs to Be Done, continuous discovery, and other prioritization models.
What Is Opportunity Scoring?
Opportunity scoring is a prioritization framework that uses customer ratings to find underserved needs. It shows which outcomes matter most and which are handled worst. Those gaps point to the best chances to create value inagile product development.
The approach is simple to explain. It does not depend on gut feel or internal politics. It depends on what customers say about their own goals.
Definition and the Two Dimensions
The opportunity scoring model rests on two dimensions.
- Importance: How much a customer cares about achieving a specific outcome.
- Satisfaction: How well current solutions help the customer achieve that outcome.
Customers rate both dimensions for each outcome. A high importance rating with a low satisfaction rating signals an opportunity. A low importance rating signals a need that can wait, even if satisfaction is also low.
Productboard describes the method as one that surfaces features customers consider essential but are dissatisfied with. Tempo calls it a technique for finding underserved customer outcomes, based on customer ratings of importance and satisfaction. Both descriptions point to the same idea. The gap between what matters and what works is where you should look.
Roots in Outcome-Driven Innovation (Tony Ulwick)
The technique comes from Anthony (Tony) Ulwick and his Outcome-Driven Innovation methodology. ODI treats innovation as a process that can be managed. It starts with the customer's job and the outcomes they want from it.
In ODI, customers use a 1 to 10 scale to rate the importance of each desired outcome and how well it is currently satisfied. Those ratings feed the opportunity algorithm. The result is an innovation opportunity score that highlights outcomes with high importance and low satisfaction.
Ulwick's underlying belief is that customers hire products to get a job done. They do not care about features or specifications for their own sake. They care about progress. This is why the framework focuses on outcomes and not on solutions.
How It Differs From Feature-Request Voting?
Many teams use voting boards or request counts to decide what to build. That approach has clear weaknesses.
Voting shows what people ask for. It does not show what people struggle with. Customers often propose solutions based on what they already know. They may not describe the deeper need.
Opportunity scoring works differently. It measures needs, not requests. It also adds satisfaction, which voting ignores. A popular request may address a need that is already well served. Opportunity scoring exposes that gap.
| Aspect | Feature-request voting | Opportunity scoring |
| What it measures | Popularity of requests | Importance and satisfaction of outcomes |
| Input type | Solution ideas | Outcome statements |
| Bias risk | Loud users dominate | Survey design and sample bias |
| Shows unmet need | Not directly | Yes, through the satisfaction gap |
| Best used for | Collecting ideas | Ranking needs |
The Opportunity Score Formula
The opportunity score calculation is short. You can run it in a spreadsheet in minutes. The logic behind it is what makes it useful.
Importance + max (Importance − Satisfaction, 0)
The standard opportunity scoring formula is:
Opportunity Score = Importance + max(Importance − Satisfaction, 0)
The max function sets a floor at zero for the gap. If satisfaction exceeds importance, the gap term becomes zero instead of negative. The score then equals importance alone.
Atlassian notes that this equation goes beyond normal gap analysis. It gives twice as much weight to importance as to satisfaction. Wikipedia's summary of ODI makes the same point. Standard gap analysis looks at the simple difference between the two metrics. Ulwick's formula weights importance more heavily.atlassian+1
You may see a simpler version in some guides: Importance + (Importance − Satisfaction). Productboard and other sources list it that way. The max version is the more common form in ODI practice. It prevents over-served outcomes from dragging scores below their importance level.
A note on inputs. Ulwick's original method uses the percentage of respondents who rate an outcome 4 or 5 on a 5-point scale, often called top-2-box. Many teams instead use average ratings on a 1 to 5 or 1 to 10 scale. Both approaches work. Choose one and apply it consistently across all outcomes.
Why Underserved Outcomes Score Highest?
The formula rewards two things at once. It rewards outcomes that customers care about deeply. It also rewards outcomes where today's solutions fall short.
Consider two outcomes with the same importance of 9. One has satisfaction of 3. The other has a satisfaction of 8. The first scores 9 + 6 = 15. The second score is 9 + 1 = 10. The underserved outcome clearly ranks higher.
Now consider an outcome with low importance and very low satisfaction. Importance is 3 and satisfaction is 1. The score is 3 + 2 = 5. The need is poorly served, but few people care. The score reflects that reality.
This is the core insight of the framework. The biggest opportunities sit where importance is high, and satisfaction is low.
Reading and Ranking Opportunity Scores
Once you calculate scores, rank the outcomes from highest to lowest. Then interpret the results in bands.
One published guide suggests scores above 10 indicate strong underserved opportunities. Scores from 7 to 10 suggest moderate opportunities worth investigating. Treat these as rules of thumb. The right thresholds depend on your scale and your data.
Look at patterns as well as numbers. Three patterns are common.
- Underserved: High importance, low satisfaction. These are your top priorities.
- Appropriately served: High importance, high satisfaction. Maintain quality and avoid overinvesting.
- Overserved: Low importance, high satisfaction. Consider simplifying or reallocating effort.
A scatter plot helps. Put importance on one axis and satisfaction on the other. Outcomes in the high-importance, low-satisfaction corner deserve attention first.
Importance vs Satisfaction Explained
The two dimensions are easy to mix up. They answer different questions. The table below separates them clearly
| Factor | Importance | Satisfaction |
| Core question | How much does this outcome matter to you? | How well does your current solution deliver it? |
| What it captures | Customer priority | Current performance |
| Typical survey wording | "How important is it that you can [outcome]?" | "How satisfied are you with your ability to [outcome] today?" |
| Typical scale | 1 to 5 or 1 to 10 | Same scale as importance |
| High value means | The need is critical | The need is well served |
| Low value means | The need is minor | The need is poorly served |
| Role in the formula | Counted twice (weighted) | Used to measure the gap |
| Business signal | Size of the prize | Room for improvement |
Both ratings must use the same scale. Otherwise, the gap calculation has no meaning. Survey wording should also match. Koji's ODI guide, for example, recommends the same 1 to 5 scale for both questions.
Importance alone can mislead. A highly important need that is already handled well offers little upside. Satisfaction alone can also mislead. A poorly served need that nobody cares about is not worth solving. The combination gives the full picture.
How to Run an Opportunity Scoring Survey Step by Step?
An opportunity scoring survey follows a repeatable process. The steps below suit most product teams. Each step builds on the one before it.
Step 1: Define the Job and Its Desired Outcomes
Start with the customer's job. A job is the progress a customer wants to make in a given situation. Keep it solution-free.
For example, "manage a team's weekly work" is a job. "Use a Kanban board" is a solution. The job stays stable even when tools change.
Next, identify the desired outcomes for that job. Outcomes describe how customers measure success. Gather them through customer interviews, support tickets, and observation, using provenproduct discovery techniques. Ask what customers try to achieve and where they struggle. Aim for a manageable list, often 10 to 30 outcomes for a single job.
Step 2: Write Outcome Statements to Rate
Outcome statements turn insights into ratable items. A good statement is specific, measurable, and free of solutions.
A common structure uses a direction, a metric, and an object of control. Examples include:
- Minimize the time it takes to see the status of all active work.
- Minimize the likelihood of missing a deadline.
- Minimize the effort required to prepare a weekly report.
Avoid statements that name a feature, such as "add a dashboard." That describes a solution. It also biases respondents toward one answer.
Test your statements with a few customers before launch. Check that each one is clear and that people interpret it the same way.
Step 3: Survey Customers on Importance and Satisfaction
Now build the survey. For each outcome, ask two questions.
- How important is it to you that you can [outcome]?
- How satisfied are you with your ability to [outcome] today?
Use one consistent scale for both. Many teams use 1 to 5. ODI practice uses 1 to 10 in some descriptions. Either works if you stay consistent.
Recruit the right respondents. Include people who actually perform the job. Consider current users, lapsed users, and competitor users. Segment the results if your audience has distinct groups, since a need may be underserved for one segment and fine for another.
Keep the survey short. Long lists cause fatigue and weaker answers. Randomize the order of outcomes to reduce position bias.
Step 4: Calculate Scores and Rank the Opportunities
Aggregate the responses for each outcome. Compute average importance and average satisfaction, or the top-2-box percentages if you follow the classic method.
Then apply the formula to each outcome:
Opportunity Score = Importance + max(Importance − Satisfaction, 0)
Sort the outcomes from highest to lowest. Review the top group with your team. Look for clusters of related outcomes. Those clusters often reveal a larger theme worth solving.
Finally, validate. Follow up with interviews on the top outcomes. Ask why satisfaction is low. The answers shape solution ideas. Many teams also build an opportunity scoring template in a spreadsheet, with columns for outcome, importance, satisfaction, gap, and score. That template keeps future surveys consistent.
Opportunity Scoring Example (Worked)
A concrete opportunity scoring example makes the method easier to apply. Imagine a product team working on a project planning tool for small agencies. The job is "manage a team's weekly work."
The team interviewed customers and wrote six outcome statements. They then surveyed 120 users. Ratings used a 0 to 10 scale, with averages shown below.
| Outcome | Importance | Satisfaction | Gap (floored at 0) | Opportunity Score |
| Minimize time to see status of all active work | 9.1 | 4.2 | 4.9 | 14.0 |
| Minimize effort to prepare a weekly report | 7.8 | 3.6 | 4.2 | 12.0 |
| Minimize likelihood of missing a deadline | 8.6 | 5.5 | 3.1 | 11.7 |
| Minimize time to find past project decisions | 7.2 | 6.0 | 1.2 | 8.4 |
| Minimize effort to customize dashboards | 5.2 | 3.1 | 2.1 | 7.3 |
| Minimize time to onboard a new team member | 6.4 | 6.9 | 0 | 6.4 |
The calculations are simple. For the first outcome, 9.1 + (9.1 − 4.2) = 14.0. For the last, satisfaction (6.9) exceeds importance (6.4). The gap is floored at zero, so the score is 6.4.
Here is how to read the results.
- Top priority: Status visibility scores 14.0. It is both critical and poorly served. This is the strongest opportunity.
- Strong contenders: Weekly reporting (12.0) and deadline risk (11.7) also score high. They deserve solution exploration.
- Watch item: Finding past decisions (8.4) has moderate importance and moderate satisfaction. It may merit a smaller investment.
- Deprioritize: Dashboard customization has low importance (5.2), so it ranks low despite weak satisfaction. Onboarding is already well served.
Notice something useful. Dashboard customization has the second-lowest satisfaction, at 3.1. A team that only watched complaints might chase it. The score shows that few customers value it highly.
The team should now run solution discovery on the top three outcomes. They would sketch ideas, test prototypes, and estimate effort before committing to the backlog.
Opportunity Scoring and Jobs to Be Done
Opportunity scoring and Jobs to Be Done share the same foundation. Understanding the link helps you use both well.
How ODI and JTBD Fit Together?
TheJobs To Be Done Framework holds that customers hire products to make progress on a job. It gives you a way to understand why people buy and switch.
ODI extends that thinking into a quantitative process. JTBD tells you what the job is. Opportunity scoring tells you which parts of the job are worst served.
Think of it as two stages. The first stage is qualitative. You interview customers to map the job and uncover outcomes. The second stage is quantitative. You survey a larger group to size and rank those outcomes. Together they move a team from insight to evidence.
Using Desired Outcomes Instead of Feature Ideas
Desired outcomes keep the conversation grounded. They describe what customers want to achieve. They do not describe how a product should look.
This matters for two reasons. First, outcomes are stable. Features change with technology, but customer goals stay consistent for years. Second, outcomes open the solution space. A team focused on "reduce time to see project status" can consider dashboards, alerts, digests, or automation. A team focused on "building a dashboard" cannot.
When you rate outcomes, you also avoid the trap of asking customers to design your product. Customers are experts on their struggles. Your team is responsible for the solutions.
Opportunity Scoring in Continuous Discovery
Continuous discovery means talking to customers and testing ideas every week. Opportunity scoring supports that habit by giving structure to what you learn.
Where Scoring Fits on an Opportunity Solution Tree?
TheOpportunity Solution Tree is a visual map. It connects a desired business outcome to customer opportunities, then to solutions, then to experiments.
Opportunity scoring helps at the opportunity layer. A tree can grow many branches. Teams need a way to decide which branch deserves attention first. Scores from an opportunity scoring survey provide that evidence.
For example, a tree may show ten opportunities under the goal "improve weekly retention." A survey can rank them. The team then focuses on the top two or three and generates solution ideas beneath them. This keeps the tree focused and prevents endless branching.
Feeding Validated Opportunities Into the Backlog
Goodproduct discovery reduces risk before delivery begins. Scoring supports that goal. It confirms that an opportunity is real before a team writes a single user story.
The handoff works like this.
- Score and rank customer outcomes.
- Select the top opportunities.
- Generate and test solution ideas.
- Estimate effort with engineering.
- Move validated solutions into the backlog as well-definedproduct backlog items.
At step 4, many teams combine scores with a delivery-focused method. Opportunity scores show customer value. Effort estimates show cost. Together they support sound decisions onfeature prioritization.
Advantages of Opportunity Scoring
The method has clear strengths. It works best when used in the right context.
1. Grounds Prioritization in Customer Evidence
Opportunity scoring replaces opinion with data. Each ranking rests on what customers reported. That makes decisions easier to explain to executives and stakeholders.
It also reduces internal debate. When two teams argue about priorities, the survey results offer a shared reference. The conversation shifts from "I think" to "customers said."
Tempo lists this approach among the frameworks to use when prioritization hinges on direct customer input rather than internal scoring.
2. Reveals Underserved Needs Competitors Miss
Competitors often copy the same visible features. They watch each other and react to the same requests. That creates crowded markets with similar products.
Opportunity scoring looks past visible features. It shows where customers feel real friction. Monday.com notes that this approach reveals underserved needs that competitors might miss. A team that finds a high-scoring gap early can differentiate in a meaningful way.
3. Reduces the Risk of Building Unwanted Features
Building the wrong feature is expensive. It uses engineering time, adds maintenance, and complicates the product. Product Owners trained throughCSPO certification learn to guard against this by tying every backlog item to real customer value.
Scoring helps avoid that outcome. Low-importance needs rank low, even when they generate noise. Over-served areas become visible, so teams stop investing where returns are small. Chameleon notes that if a feature scores low on both importance and satisfaction, it can be left out so effort goes elsewhere.
Limitations and Common Mistakes
No framework is perfect. Knowing the weak points helps you avoid poor decisions.
Survey Bias and Small Sample Sizes
Survey results are only as good as the sample. If you survey only power users, you may miss the needs of new users. If you survey only a handful of people, a few extreme answers can distort averages.
Tempo flags survey bias as a key risk, noting it can skew the results. Reduce the risk with these habits.
- Recruit a representative mix of customers.
- Collect enough responses to compare segments.
- Randomize question order.
- Use neutral wording.
- Check for outliers before finalizing scores.
Confusing Solutions With Outcomes
This is the most common mistake. Teams write statements like "have a mobile app" or "include AI summaries." These are solutions, not outcomes.
Solution-based statements lead to unclear data. A respondent might rate "mobile app" as important for very different reasons. You cannot tell what need sits behind the rating.
Rewrite each statement as a customer goal. "Minimize the time it takes to update task status while away from a desk" is an outcome. The mobile app is one possible solution.
Treating Scores as Final Rather Than Directional
A score is a signal. It is not a decision. The formula cannot see cost, technical risk, strategy, or timing.
A high-scoring outcome may need a year of engineering work. A moderate one may need two weeks. Strategy can also override scores. A company may choose a smaller market for positioning reasons.
Use scores to guide discussion. Validate them with interviews and prototypes. Then apply judgment before committing resources.
Opportunity Scoring vs Other Prioritization Methods
Opportunity scoring is one of several prioritization techniquesproduct teams use. Each answers a slightly different question.
RICE scores initiatives on reach, impact, confidence, and effort. Intercom created it to compare ideas by total impact per time worked. The formula multiplies reach, impact, and confidence, then divides by effort. Opportunity scoring does not include effort at all.
ICE uses impact, confidence, and ease. It is faster and lighter. Tempo notes it suits early-stage teams that need a simple process.
| Method | Core inputs | Uses customer survey data | Accounts for effort | Best for |
| Opportunity scoring | Importance, satisfaction | Yes | No | Finding underserved customer outcomes |
| RICE | Reach, impact, confidence, effort | Sometimes | Yes | Comparing initiatives with usage data |
| ICE | Impact, confidence, ease | Rarely | Yes (ease) | Fast decisions in early-stage teams |
| Feature voting | Request counts | Indirectly | No | Collecting raw ideas |
The methods work well together. Use opportunity scoring first to decide which customer problems matter. Then use RICE or ICE to compare the solutions you generate. This keeps the process customer-led and also delivery-aware.
Conclusion
Opportunity scoring gives product teams a clear and evidence-based way to prioritize. It measures how important each outcome is and how well it is served today. The formula, Importance + max(Importance − Satisfaction, 0), then highlights the biggest gaps.
To use it well, start with a clear job. Write outcome statements that describe goals, not features. Survey the right customers, calculate scores, and validate the results with follow-up research. Treat the output as direction, not a verdict.
Paired with Jobs to Be Done, an opportunity solution tree, and a delivery-focused method like RICE, the approach forms a strong product management workflowfrom discovery to delivery. Product owners and managers who want to apply these ideas at scale can deepen their skills through theSAFe POPM Certification Training.






 Lowest-Price Challenge











 Personalized Path


.webp)


 USA
USA  Canada
  India
India  UK
UK  Australia
  Singapore


