


 Call Us



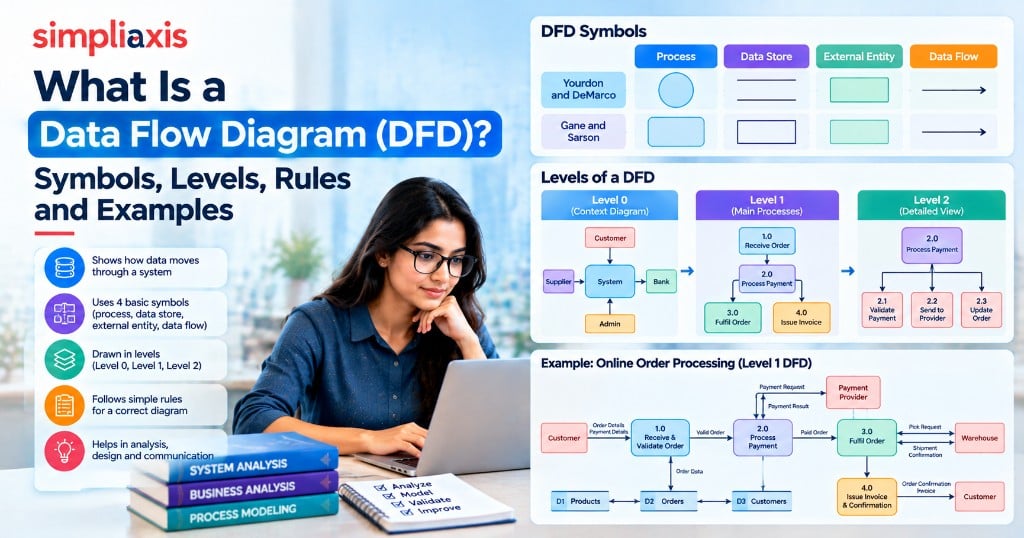
A data flow diagram (DFD) is a visual model that shows how data moves through a system: where it comes from, which processes change it, where it is stored and where it goes. It focuses on the flow of data, not on the order of steps or the timing of decisions, which makes it a useful way to explain a system to both business and technical readers.
This guide explains the DFD symbols, the levels from context diagram to detailed views, the rules for a correct diagram, a worked example, a step-by-step drawing method and how a DFD compares with a flowchart and other models.
Key Highlights of Data Flow Diagram
- A DFD shows data moving between external entities, processes and data stores.
- The four basic symbols are process, data store, external entity and data flow.
- DFDs are drawn in levels: Level 0 (the context diagram) gives the big picture, and Level 1 and Level 2 break processes into more detail.
- Two common notations are Yourdon and DeMarco, and Gane and Sarson. They differ in shapes, not in meaning.
- A DFD is not a flowchart, because it shows data movement and not control flow or decisions.
What Is a Data Flow Diagram Used For? Definition and Purpose
A DFD models a system as a set of processes that receive data, transform it and pass it on. It answers questions such as: What data enters the system? What happens to it? Where is it kept? Who receives the results?
Analysts use DFDs to understand how an existing process works, to design a new system and to explain data handling to stakeholders. Because the diagram avoids technical detail, a business user can check whether the data flows match reality. Visual Paradigm's guide to the data flow diagram and the Wikipedia entry on data-flow diagrams give further background on the history of the technique.
DFDs are part of structured analysis. They are used in business analysis, systems design and process improvement. Business analysts often combine them with other models, such as use case diagrams and process maps. Our overview of business analysis practices shows where modelling fits.
What Are the Data Flow Diagram Symbols? Yourdon-DeMarco vs Gane-Sarson Notation
Two notation styles are widely used. The meanings are the same, so pick one and use it consistently.
| Element | Yourdon and DeMarco | Gane and Sarson | Meaning |
| Process | Circle | Rounded rectangle | An activity that transforms data, such as "Validate order" |
| Data store | Two parallel lines | Open-ended rectangle | A place where data rests, such as a database or file |
| External entity | Rectangle | Rectangle | A person, group or system outside the system boundary that sends or receives data |
| Data flow | Arrow with a label | Arrow with a label | Movement of data between elements |
Process
A process takes data in and sends different data out. Name it with a verb and an object, such as "Calculate invoice". Number processes, for example 1.0, 2.0, 3.0, so you can refer to them and break them down later.
Data store
A data store holds data for later use, such as "Customer records" or "Orders". Label stores with nouns and often with a code such as D1.
External entity
An external entity is a source or destination of data outside the system. A customer, a bank or another system can be one. It is also called a terminator.
Data flow
An arrow shows data moving in a direction, and its label says what data moves, for example "Order details". Name flows with nouns, not verbs.
What Are DFD Levels? Level 0 (Context Diagram), Level 1 and Level 2 Explained
DFDs are built in levels so that detail is revealed step by step.
| Level | Also called | What it shows |
| Level 0 | Context diagram | The whole system as a single process, with its external entities and main data flows |
| Level 1 | Top-level breakdown | The main processes inside the system, the data stores and how data flows among them |
| Level 2 and below | Detailed views | A single Level 1 process broken down into sub-processes |
Level 0 DFD (context diagram)
The context diagram has one process in the middle that represents the entire system, surrounded by external entities, with arrows showing the data they send and receive. It defines the system boundary and is the first diagram to draw. For readers who want a similar high-level view in process improvement, a SIPOC diagram serves a comparable purpose.
Level 1 DFD
Level 1 opens the central process into three to nine main processes, adds the data stores and shows how data moves among them. Every external entity and data flow from Level 0 must still appear.
Level 2 DFD
Level 2 takes one process from Level 1 and breaks it down further. Not every process needs a Level 2. Go deeper only where the detail helps someone understand or build the system.
What Are the Rules for Drawing a Correct DFD?
Following a few rules keeps diagrams consistent and readable.
1. Every process must have at least one input and at least one output.
2. Data cannot flow directly between two external entities. It must pass through a process.
3. Data cannot flow directly between two data stores. A process must handle it.
4. Data cannot flow directly between an external entity and a data store. A process must sit between them.
5. Each data flow must have a clear name that describes the data.
6. Processes need unique names and numbers.
7. Child diagrams must balance with their parents, meaning the inputs and outputs of the parent process match those of the child diagram.
8. Avoid crossing lines where possible, and keep a diagram to about seven processes or fewer.
Common errors have names:
- Black hole: a process with inputs but no outputs
- Miracle (or spontaneous generation): a process with outputs but no inputs
- Gray hole: a process whose outputs cannot be produced from its inputs
Data Flow Diagram Example: Online Order Processing at Level 0 and Level 1
This is an illustrative example, described in text and tables so that you can draw it.
Level 0 (context diagram)
- System: Order processing system
- External entities: Customer, Warehouse, Payment provider
- Data flows in and out
| From | To | Data flow |
| Customer | System | Order details, payment details |
| System | Customer | Order confirmation, invoice |
| System | Warehouse | Pick request |
| Warehouse | System | Shipment confirmation |
| System | Payment provider | Payment request |
| Payment provider | System | Payment result |
Level 1 (main processes)
| Process | Inputs | Outputs |
| 1.0 Receive and validate order | Order details (from Customer), Product data (from Products store) | Valid order (to Orders store), Rejection message (to Customer) |
| 2.0 Process payment | Valid order, Payment details | Payment request (to Payment provider), Payment status (to Orders store) |
| 3.0 Fulfil order | Paid order (from Orders store) | Pick request (to Warehouse), Shipment confirmation (from Warehouse, to Orders store) |
| 4.0 Issue invoice and confirmation | Order and payment status (from Orders store) | Order confirmation and invoice (to Customer) |
Data stores: D1 Products, D2 Orders, D3 Customers
To draw it, place the four processes in the middle, the three external entities around them, the three stores along the bottom and connect with labelled arrows. Check that every process has an input and an output and that no entity connects to a store directly.
Data Flow Diagram Example 2: Library Management System (Level 0 Summary)
A second, shorter example shows the same method in another domain.
| Element | Content |
| System | Library management system |
| External entities | Member, Librarian, Publisher |
| Inputs to the system | Membership details, book requests, return details, new book orders |
| Outputs from the system | Loan confirmation, due-date reminders, fine notices, purchase orders |
| Level 1 processes | 1.0 Manage membership, 2.0 Issue and return books, 3.0 Calculate fines, 4.0 Manage catalogue and orders |
| Data stores | D1 Members, D2 Books, D3 Loans, D4 Fines |
If you are asked to draw a DFD in an exam or interview, state the scope, list the entities, then draw Level 0 before Level 1.
How Do You Draw a Data Flow Diagram? Step-by-Step Guide
1. Define the scope. Decide what the system includes and excludes.
2. List external entities. Identify who or what sends data to the system or receives data from it.
3. List the main data flows. For each entity, note what data goes in and out. Interviews and workshops from requirement elicitation help you find them.
4. Draw the context diagram. One process, the entities and the flows.
5. Identify the main processes. Break the system into three to nine major processes for Level 1.
6. Add data stores. Show where data must be kept between processes.
7. Draw and label the flows. Connect processes, stores and entities with named arrows.
8. Check the rules. Look for black holes, miracles, direct links between entities or stores and unbalanced levels.
9. Decompose where needed. Create Level 2 diagrams for complex processes.
10. Validate with stakeholders. Walk through the diagram with the people who know the work and fix gaps.
Tools such as draw.io, Lucidchart, Visio and many modelling tools include DFD shapes, and SmartDraw offers templates, while a whiteboard is fine for first drafts. To see how data and process modelling feed requirements, read about the requirements traceability matrix.
Data Flow Diagram vs Flowchart: What Is the Difference?
DFDs and flowcharts look similar but answer different questions.
| Aspect | Data flow diagram | Flowchart |
| Focus | Movement and storage of data | Sequence of steps and decisions |
| Shows decisions and loops | No | Yes |
| Shows timing or order | No | Yes |
| Main symbols | Process, data store, external entity, data flow | Start and end, process, decision, arrows |
| Typical use | Systems analysis and design, data handling | Process documentation, algorithms, procedures |
| Detail levels | Built in (Level 0, 1, 2) | Usually a single level, or sub-processes |
If you need to show how a process runs step by step, use a flowchart or a process map. If you need to show how data moves between people, systems and stores, use a DFD. Our guide to process mapping covers the first, and value stream mapping extends it to flow and waste.
DFD vs Use Case Diagram vs ER Diagram: Which Model Fits Which Question?
Analysts rarely use one model alone. This table shows how three common models differ.
| Model | Main question | Shows | Typical audience |
| Data flow diagram | How does data move through the system? | Processes, stores, entities, flows | Analysts, developers, business users |
| Use case diagram | Who uses the system and for what goals? | Actors and use cases | Stakeholders and analysts |
| Entity relationship (ER) diagram | What data is stored and how is it related? | Entities, attributes, relationships | Database designers and analysts |
A common sequence is to use a use case diagram for scope, a DFD for data movement and an ER diagram for the data structure. For the first, see our comparison of use case vs user story, which also shows how models connect to Agile requirements.
What Are the Benefits and Limitations of Data Flow Diagrams?
Benefits
- They give business and technical teams a shared view of the system.
- They show gaps and duplication in data handling.
- They define the system boundary clearly.
- They support requirements, design and documentation.
- They are simple enough to draw with stakeholders in a workshop.
Limitations
- They do not show sequence, timing or decisions.
- Large systems need many linked diagrams.
- They can go stale if they are not maintained.
- They suit structured analysis more than some modern, event-driven or Agile designs, where other models may fit better.
Used for process improvement work, DFDs also help teams spot duplicated data entry and handoffs, which is the focus of process improvement projects.
Are Data Flow Diagrams Still Useful in Agile Teams and Modern Architectures?
Yes, in a lighter form. Agile teams rarely draw complete multi-level DFDs for a whole system, but they often sketch a context diagram or a Level 1 view on a whiteboard to agree how data moves before they build. Data-heavy work such as integrations, reporting pipelines, privacy reviews and migrations still benefits from a clear picture of sources, transformations and destinations. The role of the analyst in these teams is described in our guide to the Agile business analyst, who tends to model just enough to remove doubt and then keep the diagram close to the backlog.
What Are the Most Common DFD Mistakes?
- Too much detail at the first level. Start with the context diagram.
- Labelling flows with verbs or leaving them unlabelled. Use nouns that describe the data.
- Mixing control flow with data flow. Show decisions elsewhere.
- Unbalanced levels. Child diagrams must match their parent.
- Direct links between entities or stores. Always route through a process.
- Treating the diagram as the specification. It supports requirements, but does not replace written ones.
Conclusion
A data flow diagram is a clear way to show how data moves through a system. Start with a context diagram, break the system into main processes, add data stores, label every flow and check the rules. Use DFDs together with other models and written requirements, and keep them as simple as the audience needs.
Begin your business analysis journey: Learn modelling and requirements basics with the ECBA certification training.
Grow into senior analysis roles: Advance with the CBAP certification training.



_1747641504.jpg)




 Lowest-Price Challenge











 Personalized Path


.webp)


 USA
USA  Canada
 India
India UK
UK Australia
 Singapore


