


 Call Us



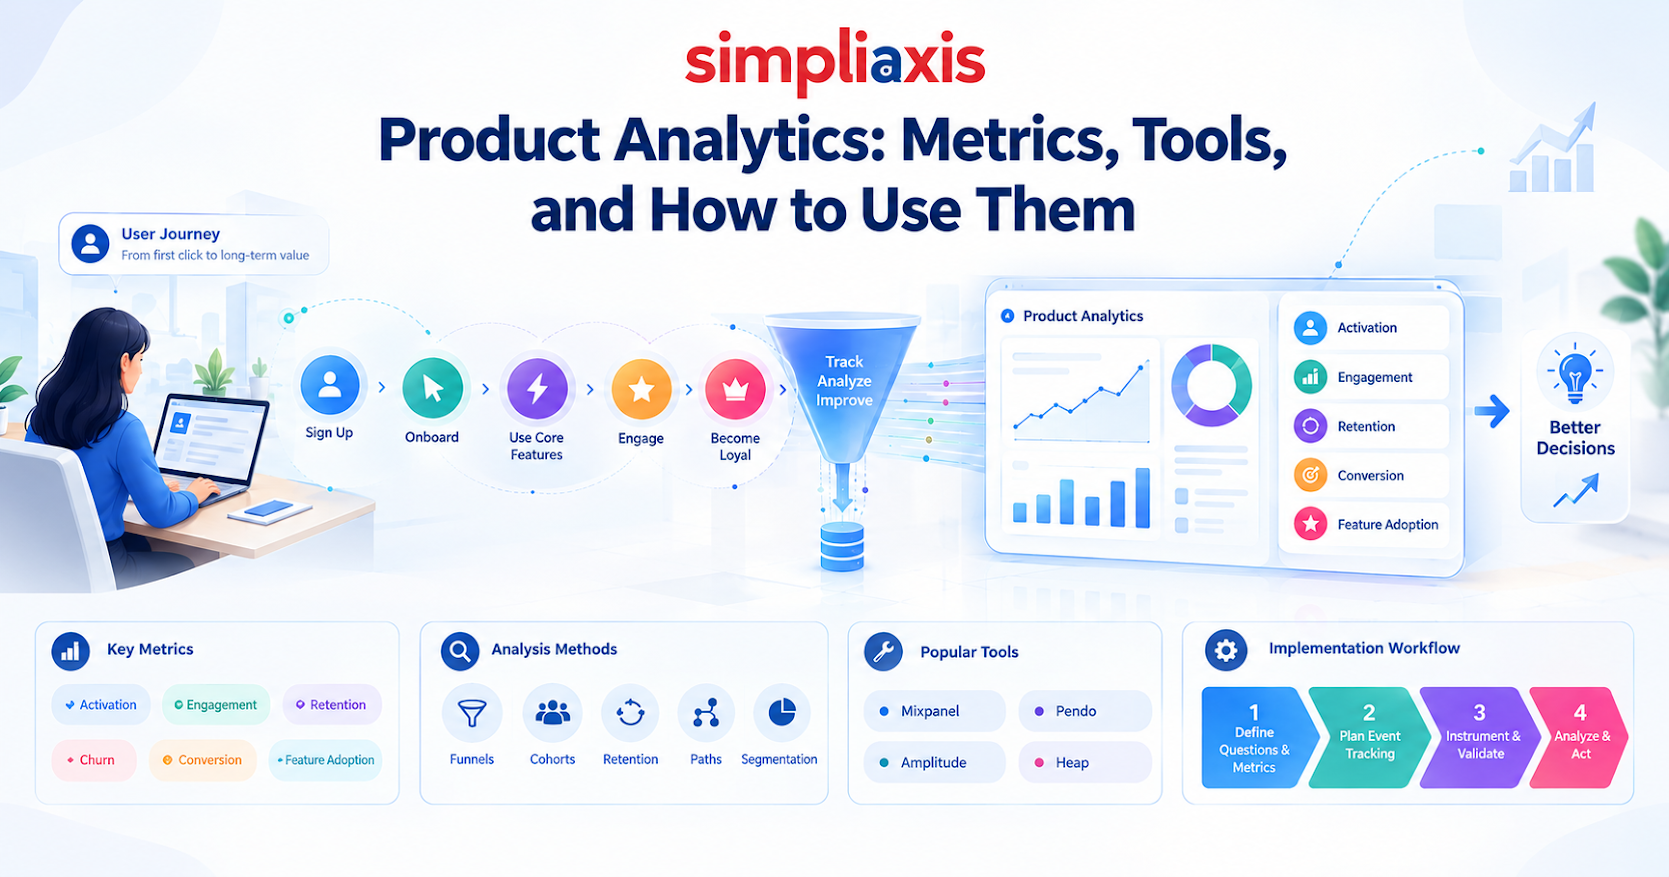
Product analytics is the practice of collecting and analyzing data on the way individual users behave to understand how customers use a digital product. The results help product teams to measure activation, engagement, retention, conversion, feature adoption, and other product metrics.Traditional web analytics focuses on traffic and acquisition, while product analytics is concerned with understanding what customers do within a product and how their behaviour changes over a particular period. It usually depends on events like Sign Up, Create Project, Invite Teammate, Complete Purchase, or Use Feature. The goal is not simply to create more reports. It is to answer product questions and turn those answers into better decisions.
Key Highlights of Product Analytics
Product analytics connects user behaviour with product and business outcomes.
The key product analytics metrics are activation, engagement, retention, churn, conversion, and feature adoption.
The user journey can be looked at in a number of ways, such as through funnel, cohort, retention, path, behavioural, and segmentation analysis.
Examples of product analytics tools include Mixpanel, Amplitude, Pendo, Heap, and others.
The proper approach to product analytics is to begin with business questions and clearly defined metrics, rather than collecting data on every feature and every aspect.
Product owners and product managers can make use of analytics to decide on the priority of items in their backlog, to verify their hypotheses, and to assess the outcomes.
Product analytics works especially well with qualitative research, A/B testing, and product discovery.
In Agile and SAFe environments, analytics can help teams move from measuring delivery output to measuring customer and business outcomes.
Introduction
Product teams make decisions constantly: Which feature should we build? Why are users abandoning onboarding? Which customers are most likely to churn? Does the newest release fix activation? Do we build a new workflow or improve an existing workflow?
Behavioural data provides another layer of evidence, but experience and consumer input are key to answering these questions.
So let’s say you have a SaaS product that has been getting a lot of complaints about its reporting feature being hard to use. Interviews reveal that report configuration is difficult for users. But product analytics show that 70% of users reach the report builder, but only 18% complete their first report. A path analysis reveals that most users repeatedly revisit the same configuration screen before they abandon the workflow. Now the enterprise team has an actual issue to deal with. This is the true power of product analytics: it transforms vague questions about user behaviour into observable patterns that teams can test and improve.
What Is Product Analytics?
Product analytics uses behavioural data to understand what users do within a digital product. Data may include clicks, page or screen views, feature usage, searches, transactions, workflow completion, invitations, upgrades, and other meaningful events.
Modern product analytics platforms generally organize this information around users, events, sessions, accounts, and properties. This makes it possible to connect individual actions with broader outcomes such as activation, retention, conversion, and revenue.
Product Analytics Definition
Product analytics is the systematic collection and analysis of user behaviour within a product to detect trends, measure product performance, and inform decisions that improve customer and business outcomes. The main idea is the event. An event represents an action a user takes, such as:
Account created
Tutorial completed
Project created
Search performed
Feature used
Team member invited
Subscription upgraded
Purchase completed
Events can then be combined into journeys and analyzed by user type, acquisition channel, plan, device, geography, cohort, or other relevant attributes.
For example:
Sign Up → Complete Profile → Create Project → Invite Teammate → Return in 7 Days
This sequence could become the foundation of an activation analysis.
Product Analytics vs Web Analytics
Product analytics and web analytics overlap, but they answer different questions.
Area | Web Analytics | Product Analytics |
Primary focus | Website traffic and acquisition | In-product behaviour |
Typical users | Marketing and growth teams | Product, growth, UX, and data teams |
Common data | Sessions, pageviews, sources | Events, funnels, cohorts, retention |
Typical question | Where did visitors come from? | What did users do after signing up? |
Time horizon | Often session and acquisition-focused | Often longitudinal and cohort-based |
Main objective | Improve acquisition and conversion | Improve activation, engagement, retention, and product value |
The distinction is not absolute. Modern analytics platforms can track both web and product events. The more useful distinction is the decision the data needs to support. For example, “Which campaign generated the most sign-ups?” is primarily an acquisition question. “Which actions taken during the first week predict long-term retention?” is a product analytics question.
Why Product Analytics Matters?
Product analytics helps teams replace assumptions with evidence and answers:
Which features are actually being adopted?
Where do users abandon onboarding?
Which behaviours correlate with retention?
What differentiates high-value customers from inactive users?
Which product changes improve conversion?
Where should the team focus for its upcoming experiment?
The connection between activation and retention is particularly important. Amplitude's analysis of more than 10,600 products found that 69% of top performers in seven-day activation were also top performers in three-month retention.
That does not mean activation is the only metric that matters. It means teams should understand which early product behaviours are associated with users reaching sustained value.
Key Product Analytics Metrics
There is no universal list of product analytics metrics that every organization should track. The right product metrics are dependent on the product business model, customer lifecycle, and journey. However, most teams should examine metrics across four areas: activation, engagement, retention, and conversion. The Metrics that Matter: Improving Product Outcomes microcredential covers how Agile teams choose and use metrics like these.
Activation and Onboarding
Activation measures whether a new user reaches a meaningful value milestone. The important question is not necessarily whether someone completed onboarding. It is whether they experienced the product's core value. For a collaboration platform, activation might:
Develop a workspace, invite one teammate, and complete one common task.
For a budgeting app, it could be:
Connecting an account, creating a budget, and categorizing the first transaction.
Common activation metrics include:
Activation rate
Time to value
Onboarding completion rate
First-value-event completion
Percentage reaching the product's “aha” moment
The formula for the useful activation rate is:
Activation Rate = Activated Users ÷ New Users × 100 |
For example, if 1,000 users sign up and 350 complete the defined activation event, activation is 35%.
Engagement and Stickiness
Engagement assesses the frequency and comprehensiveness of communication of customers with the product. Common measures include:
DAU: Daily Active Users
WAU: Weekly Active Users
MAU: Monthly Active Users
DAU/MAU ratio
Feature adoption
Sessions per user
Events per active user
Frequency of key workflows
The DAU/MAU ratio is sometimes used as a proxy for product stickiness. However, teams should define “active” around meaningful behaviour rather than arbitrary activity. For example, logging into a project-management application once may be less meaningful than creating or completing a task
Retention and Churn
Retention measures whether users continue returning to the product or performing a defined value-generating action. A basic retention calculation is
Retention Rate = Users Returning During a Defined Period ÷ Original User Cohort × 100
Retention can be measured daily, weekly, monthly, or according to the natural usage cycle of the product. For example, a daily-use communication product may care about day-seven retention, while an enterprise tax application may have a very different usage cycle.
Churn is the opposite side of the equation. Teams can analyze:
Customer churn
User churn
Revenue churn
Logo churn
Feature-level disengagement
Churn by customer cohort
The most useful analysis often goes beyond "How many users churned?” and asks, "What happened before they churned?"
Conversion and Funnels
Conversion metrics show how users progress toward a desired outcome. Here is a presentation of the product analytics funnel:
Sign Up - Verify Email - Create Project - Invite User - Upgrade
Suppose 10,000 users sign up:
8,000 verify their email
5,500 create a project
2,500 invite another user
700 upgrade
The largest drop-off may show where further investigation is warranted. Funnels are primarily useful for onboarding, checkout, subscription upgrades, feature adoption, and other sequential workflows.
Types of Product Analysis
A strong product analytics framework embeds different approaches instead of depending on a single dashboard. Here are different types of product analysis.
Funnel Analysis
Funnel analysis calculates the progression by following pre-defined steps. It helps enterprise teams identify:
Where users drop off.
Which steps have unusually low conversion?
Differences between user segments
Whether a product change improves completion
For instance, an e-commerce team may find out that checkout conversion drops sharply when users reach the shipping information step. That finding can trigger usability testing or an experiment.
Cohort Analysis
Cohort analysis groups users based on a shared characteristic or starting point. Common cohorts include:
Users who signed up in the same week
Users acquired through the same campaign
Customers on the same plan
Users who adopted a particular feature
Customers from a specific industry
For example, compare users who adopted a new collaboration feature to users who didn’t. If retention is better in the adopting cohort, there is a hypothesis for the team to work with.” But correlation does not equal causation. Further research or testing may be required. For a refresher on descriptive versus predictive approaches, see this guide to data analysis methods and types.
Retention Analysis
Retention analysis examines whether users continue to return or complete a defined value action. A retention chart can reveal patterns that an overall active-user number hides.
For example, total MAU may remain stable while new-user retention steadily declines. Without cohort analysis, the problem could remain hidden because older customers continue generating activity.
Path and Behavioural Analysis
Path analysis examines the sequences of actions users take. Instead of asking, “Did users complete the onboarding funnel?” you can ask:
What did users actually do before they activated or abandoned the product?
This can reveal unexpected journeys. For example, users may overlook the official onboarding checklist and go directly to search. If highly retained users continuously follow this, then the product team should rethink the onboarding experience.
Segmentation
Segmentation categorizes users into meaningful groups so teams can compare behaviour. Useful dimensions include:
- Free vs. paid users
- Enterprise vs. SMB customers
- New vs. returning users
- Mobile vs. desktop
- Geography
- Acquisition channel
- Customer industry
- Feature adoption
Segmentation prevents averages from hiding important differences. A 40% overall activation rate may sound healthy until the team discovers that enterprise users activate at 65% while self-serve users activate at only 22%.
Popular Product Analytics Tools
The market includes many product analytics tools, and the right choice depends on factors such as event collection, analysis capabilities, experimentation, integrations, governance, pricing, and technical resources.
Mixpanel, Amplitude, Pendo, and Heap
Mixpanel provides event-based product analytics with capabilities for funnels, retention, cohorts, segmentation, and behavioural analysis. Its current platform also combines product analytics with experimentation and other capabilities.
Amplitude offers different types of product analytics capabilities, such as onboarding, product health, feature engagement, retention, etc. Its product analytics workspace covers prebuilt views for active users, onboarding funnels, feature engagement, and retention.
Pendo offers product analytics and product experience capabilities. One key differentiator is the automatic interaction capture that allows teams to analyze user behaviour without defining every interaction with manual event instrumentation beforehand.
Heap is focused on automatically capturing behavioural data. Its auto-capture method captures interactions such as clicks, swipes, page views, and form activity, and teams can also create custom events and enrich the data.
When looking for product analytics software, don’t just settle on the one with the most charts/features. See if the platform can provide accurate answers to the questions your team really needs to have answered. The right product analytics platform should support reliable data collection, flexible analysis, segmentation, dashboards, governance, integrations, and a workflow for turning insights into action. Teams exploring AI-assisted analysis can look at theICAgile AI for Product Metrics micro-credential.
How to Set Up Product Analytics Step by Step?
A successful product analytics implementation is less about installing software and more about establishing a repeatable measurement process.
Step 1: Define Questions and Metrics
Start with decisions, instead of events, and don't say, “Let's track everything.” You should start questioning:
Why are new users turning away from onboarding?
What behaviour predicts retention?
Which features drive expansion?
Where does checkout conversion fall?
Is the new feature delivering value?
Then define the metrics needed to answer those questions. This prevents teams from creating hundreds of events without knowing what they mean.
Step 2: Plan Your Event Tracking
Create an event taxonomy. For example:
Event | Meaning | Important Properties |
Sign Up | New account created | Source, plan, device |
Project Created | First project created | Template, team size |
Invite Sent | User invites a teammate. | Invite type |
Feature Used | Core feature used | Feature name |
Upgrade | User becomes paid | Plan, price |
Make sure that a consistent naming convention is used and that the event definitions are documented. Your tracking plan should also include details on ownership, the types of data, the required properties, and the privacy considerations.
Step 3: Instrument and Validate
Implement the events using the chosen analytics platform or SDK. Do not assume that data is correct simply because events appear in a dashboard.
Validate
Event names
Event properties
User identity
Duplicate events
Missing events
Time stamps
Cross-device behaviour
Production vs. test traffic
Tools with autocapture can reduce some instrumentation work. For example, Heap states that its autocapture collects interactions automatically and allows teams to define events retroactively.
However, automatic collection does not remove the need for a clear measurement strategy.
Step 4: Analyze and Act
In this final step, product analytics develops business value. Create a product analytics dashboard that focuses on a manageable set of metrics rather than dozens of disconnected charts. A dashboard might contain:
Activation rate
Weekly active users
Feature adoption
Conversion rate
Retention
Churn
Key funnel performance
If your team builds these views in a BI tool, a Microsoft Power BI skills coursecan speed up dashboard work.
For example, users may skip the official onboarding checklist and go directly to search. If highly retained users frequently follow that path, the product team may need to rethink the onboarding experience.
Product Analytics Examples
Consider a subscription-based learning platform. The team notices that free-to-paid conversion has fallen from 9% to 6%. A simple revenue report tells them that conversion is down. Product analytics allows them to investigate.
They build a funnel:
Course Started - Lesson Completed - Assessment Completed - Course Completed - Upgrade
The analysis shows the greatest drop happens between completing the assessment and finishing the course. The team segregates the data and finds mobile users have a much lower completion rate than expected.
Sometimes, after submitting an assessment, the next lesson fails to load, mainly due to path analysis. This is where they correct the mobile transition and run an A/B test against the current experience. This instance shows how analytics can connect a business metric to a product behaviour.
Another example involves a collaboration tool.
Suppose users who invite at least one teammate have much stronger 30-day retention than solo users. The product team can use this insight to explore whether improving collaboration onboarding increases long-term value.
The important point is that product analytics examples should lead to decisions, not simply interesting observations. Analytics can also strengthenproduct strategy by connecting product-level behaviour with broader business objectives.
Product Analytics in Agile and SAFe
In product analytics in product management, we should focus on using evidence to make better product decisions, not on turning every metric into a target. Analytics can help product owners and product managers to prioritize the backlog, develop hypotheses, evaluate features, and measure outcomes.
Teams working with SAFe can also leverage product analytics to reinforce the connection between customer behaviour, product goals, and delivered value. For professionals developing these skills, SAFe POPM Certification Training provides structured learning around the product owner/product manager role, while SAFe POPM roles and responsibilities provide additional context on those responsibilities.
Turning Insights Into Backlog Items and Experiments
Suppose analytics shows that 60% of users abandon a critical setup workflow. Rather than immediately writing:
“Redesign setup screen.”
The team can frame a hypothesis:
“If we simplify setup from five steps to three, more new users will reach the activation event.”
The backlog item can then include:
Problem statement
Evidence
User segment
Hypothesis
Expected outcome
Success metric
Experiment or validation approach
When several hypotheses compete for attention, MoSCoW prioritization helps decide which to test first.
This makes analytics part of product discovery rather than merely reporting.
Measuring Outcomes, Not Just Output
Agile teams can easily measure output:
Features completed
Stories delivered
Releases shipped
Velocity
These measures can be useful for understanding delivery, but they do not necessarily demonstrate customer value. Product analytics adds outcome measures such as
Activation
Adoption
Retention
Conversion
Customer behaviour
Revenue impact
For example, shipping a redesigned onboarding flow is an output. Increasing activation from 30% to 40% is an outcome. This guide on OKR vs KPIexplains how outcome targets like this fit into team goals. A useful north star metric should reflect sustained customer value while connecting to the organization's broader objectives. Teams can learn more about this concept through the North Star metric resource.
Common Product Analytics Mistakes
Even sophisticated teams can misuse product analytics.
1. Tracking everything without a purpose
Just because more data is available doesn't mean that better decisions will be made; trust in event data tends to break down quickly if there are no definitions and no clear owner.
2. Choosing vanity metrics
High numbers of pageviews or sign-ups may appear impressive even if retention is falling. It is important to always link activity metrics to meaningful outcomes.
3. Mistaking correlation for causation
The fact that users who take up a feature show better retention does not necessarily show that the feature was the cause of that retention; it's possible that the users were already more engaged. Use experiments and qualitative research where appropriate.
4. Building dashboards nobody uses
A dashboard with 40 charts may create more confusion than clarity. Prioritize a small set of decision-relevant metrics.
5. Ignoring data quality
Broken event tracking can lead to convincing but incorrect conclusions. Regularly audit instrumentation and metric definitions.
6. Focusing only on quantitative data
Analytics tells you what happened. It does not always explain why. Hence, you should embed product analytics with interviews, surveys, usability testing, session recordings, support conversations, and product discovery.
7. Optimizing a local metric
Improving one funnel step can sometimes damage the broader customer experience. For example, aggressive prompts may increase a short-term conversion rate while reducing long-term retention. Measure the complete customer journey.
Conclusion
Product analytics gives product teams a structured way to understand what users actually do, not what teams assume they do. By tracking meaningful events and analyzing activation, engagement, retention, conversion, and feature adoption, teams can identify friction, discover valuable behaviours, prioritize opportunities, and evaluate whether product changes are producing meaningful outcomes.
The strongest analytics programs do not begin with a tool. They begin with questions.
Define the problem. Choose the right metric. Instrument the relevant behaviour. Analyze the evidence. Form a hypothesis. Test it. Then measure what changed.
Used this way, product analytics becomes more than a reporting system. It becomes part of the product development process itself and assists teams in making informed decisions throughout discovery, delivery, experimentation, and continuous improvement.

-Roles-and-Responsibilities-Blog-Banner_1741938660_1742278982.jpg)







 Lowest-Price Challenge











 Personalized Path


.webp)


 USA
USA  Canada
 India
India UK
UK Australia
 Singapore


