


 Call Us




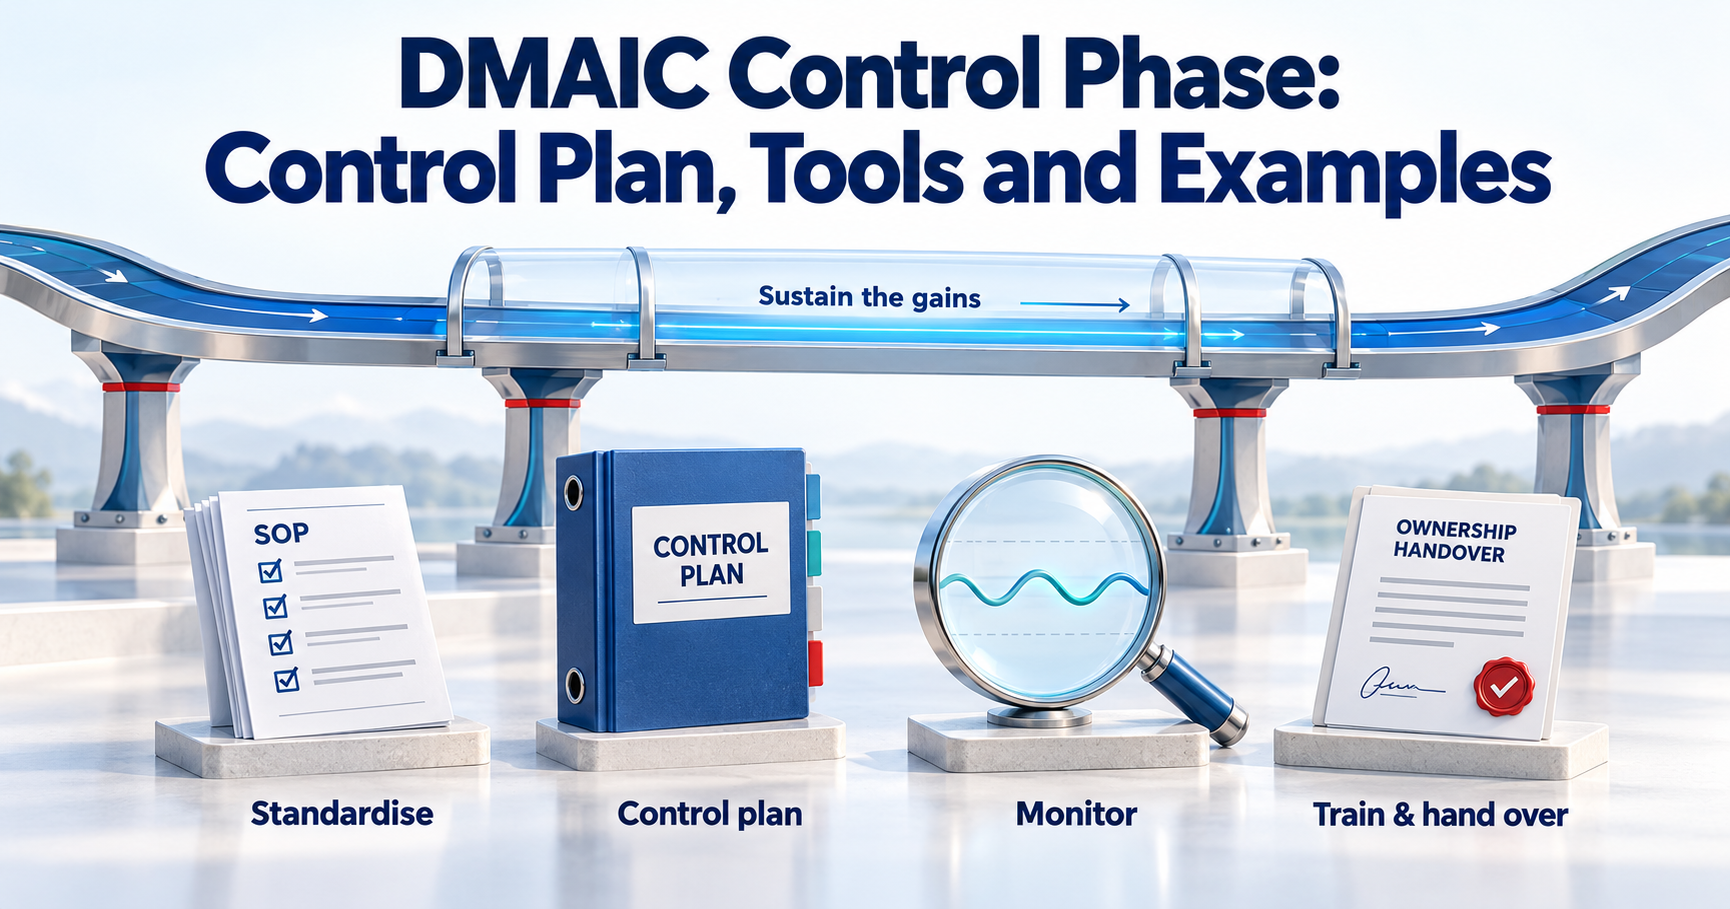
The DMAIC control phase is the fifth and final stage of a Six Sigma project. Its job is to make sure the gains from the Improve phase do not fade once the project team moves on. The team standardises the new way of working, writes a control plan, tracks the key measures with control charts, agrees a response plan for when results slip, trains the people who run the process and hands ownership to the process owner. The project closes only after the benefits are confirmed with real data.
Key Highlights of DMAIC Control Phase
- Control is the last phase of DMAIC, and its single aim is to stop an improved process from sliding back to old habits.
- The four core steps are: standardise the new process, build the control plan, monitor with control charts, and train and hand over.
- A control plan records what is measured, how often, by whom and what happens when a result goes out of bounds.
- Control charts separate normal day-to-day variation from real signals, so people react to the right things.
- The project is closed at a tollgate review, where the sponsor checks results, documents and benefit figures.
- Most failures in this phase come from weak ownership, missing response plans and monitoring that stops too early.
Introduction
Most improvement teams have seen this happen. A project halves defects, leadership applauds, and everyone moves on. Six months later, the process has quietly drifted back to where it started. Nobody broke anything on purpose. People simply went back to what they knew.
This is the problem the DMAIC control phase is built to solve. In theDMAIC process, Define, Measure, Analyze and Improve take a team from a vague problem to a tested solution. Control is where that solution becomes the normal way of working, with clear owners, simple checks and a plan for what to do when things start to slip.
It is also the phase most often rushed, because the exciting work feels finished. Yet this is where the return on all the earlier effort is protected or lost.
This guide covers the purpose of the control phase, its steps and tools, a worked control plan example, project closure, the tollgate review and the mistakes that most often undo good work.
Purpose of the Control Phase
The purpose of the control phase in Six Sigma is simple to state: hold the gains. The Improve phase proves that a new way of working performs better, usually through a pilot. The Control phase makes sure that better performance continues after the pilot ends, the project team steps back and daily pressure returns.
In practice, that purpose breaks down into five goals:
- Make the new method the standard: The improved steps are written into procedures, checklists, system settings or forms so that people follow one agreed way of working.
- Watch the measures that matter: The team picks the key outputs (often called Ys) and the key inputs (Xs) that drive them, then sets up regular measurement.
- Detect problems early: Statistical tools, mainly control charts, show when a process has genuinely changed rather than just having a normal bad day.
- React in a planned way: A response plan spells out who acts, what they do and how quickly, so a problem is fixed before it spreads.
- Transfer ownership: Theprocess owner, not the Belt or the project team, takes long-term responsibility for results.
Think of Control as the move from project mode to business-as-usual. If the improvement only holds while the project lead is watching, the phase has not done its job.
Control also closes the loop on the business case. TheDefine phase promised a certain benefit, such as fewer errors, faster turnaround or lower cost. Control is where the team shows, with data, whether that promise was kept.
Control Phase Steps
There is no single fixed checklist, but most control phase Six Sigma projects follow the same four steps. They overlap in time, and the outputs of one feed the next.
Standardise the New Process
An improvement that lives only in people's heads will not last. The first step is to document the new way of working so that anyone doing the job does it the same way.
This usually means updating SOPs, work instructions, checklists andprocess maps. Good standard work is short, visual and written for the person doing the task, not for an auditor. A one-page checklist with screenshots often beats a 20-page policy.
Wherever you can, go further than documents. Mistake-proofing (poka-yoke) builds the method into the process itself, such as a mandatory form field or a system rule that blocks an invoice without a purchase order number. A control that cannot be skipped beats one that relies on memory.
Finally, retire the old method. Remove outdated forms, archive old procedure versions and switch off old system paths. If the old way is still available, some people will keep using it.
Build the Control Plan
The control plan is the central document of this phase. Acontrol plan in Six Sigmais a written summary of how the improved process will be monitored and kept on track. It lists the critical process steps and characteristics, the target or specification for each, how and how often each is measured, who measures it and what to do if a result falls outside the agreed range.
A useful control plan Six Sigma teams can actually work with covers both outputs and inputs. Watching only the final output (for example, defect rate) tells you about a problem after it has happened. Watching the key inputs that drive it (for example, training completion or machine temperature) lets you act earlier.
The response plan, sometimes called a reaction plan, is usually built into the control plan. It answers three questions for every measure: what counts as a trigger, who acts and what the first containment step is. We look at a full example later in this article.
Monitor With Control Charts
Once the process is standardised, you need a way to tell normal variation from real change. That is the job of thecontrol chart, a tool developed by Walter Shewhart in the 1920s.
A control chart plots a measure over time against a centre line (the average) and upper and lower control limits, usually set at three standard deviations from the average. These limits are calculated from the process data itself. They are not the same as specification limits, which come from customers or requirements.
Points inside the limits that show no pattern suggest common-cause variation, the normal noise of a stable process. Signals of special-cause variation include:
- A single point outside a control limit
- A run of eight or more points on one side of the centre line
- A steady trend of six or more points moving up or down
- Two out of three points more than two standard deviations from the centre line, on the same side
The right chart depends on your data. Individual-moving range (I-MR) or X-bar and R charts suit continuous data such as cycle time or weight. P-charts and np-charts track the proportion or count of defective items, while c-charts and u-charts track counts of defects.
One practical point: recalculate control limits using data from the improved process, not the old one. Limits based on pre-improvement data will be too wide and will hide real problems.
Train and Hand Over
The last step moves the process from the project team to the people who will run it every day. Training should cover the new procedure, how to collect and record data, how to read the control chart and exactly what to do when the response plan is triggered.
The handover should be formal: the process owner reviews the control plan, confirms they have the resources to run it and signs off. A short overlap period, often a few weeks, helps before the project lead steps away.
Control Phase Tools
Control phase tools are simple on paper. The hard part is using them consistently. Many of them are also part of the wider set ofSix Sigma Green Belt toolsyou use in earlier phases, such as process maps and measurement system checks. The four below form the core of most control phases.
Tool | Purpose | Owner | Frequency |
| Control plan | Records each critical input and output, its target, measurement method, sample size, owner and reaction steps in one place | Process owner (drafted by the Green Belt or Black Belt) | Reviewed monthly at first, then quarterly, and updated whenever the process, equipment or system changes |
| Control chart | Plots a key measure over time against control limits to separate normal variation from special-cause signals | Process owner or team lead, with front-line staff plotting the data | Updated at the sampling interval in the control plan, such as each shift, day or batch, and reviewed weekly |
| Standard operating procedure | Documents the improved method step by step so everyone performs the task the same way | Process owner, with the quality or document control team managing versions | Checked through regular audits, often monthly or quarterly, and formally reviewed at least once a year |
| Response plan | Sets the trigger, the first containment action, who acts, the deadline and the escalation path when a measure goes out of bounds | Named responder for each measure (often a supervisor), with escalation to the process owner | Used every time a trigger occurs, and tested or reviewed with the control plan |
Supporting tools include mistake-proofing, visual management boards, regular process audits and a training plan with a skills matrix.
Control Plan Example
DMAIC control phase examples are easier to follow when they are tied to a real-looking process, so here is one from a finance team.
The project: A mid-sized company's accounts payable team took nine working days on average to process a supplier invoice, and around 6% of invoices needed rework because of missing or mismatched data. Late payments were hurting supplier relationships and causing missed early-payment discounts.
The improvements: In the Improve phase, the team made the purchase order (PO) number a mandatory field in the supplier portal, introduced a three-way match checklist (PO, goods receipt and invoice), and set a daily cut-off for routing exceptions to buyers. A six-week pilot cut the average cycle time to four days and rework to 1.5%.
The control plan: To hold these gains, the Green Belt and the accounts payable manager built the control plan below.
Process step | What is measured | Target or limit | Method and sample | Frequency | Owner | Response if out of bounds |
| Invoice receipt | Invoices received without a PO number (input) | 0% (portal blocks submission) | System exception report, all invoices | Weekly | AP team lead | Check the portal rule within 1 working day; contact the supplier and buyer |
| Three-way match | Checklist completion (input) | 100% of invoices | Audit of 20 random invoices | Weekly | AP team lead | Retrain the clerk involved; review checklist clarity |
| Exception routing | Exceptions sent to buyers by daily cut-off (input) | 95% or more | Workflow report | Daily | AP supervisor | Escalate overdue exceptions to the buyer's manager the same day |
| Invoice processing | Cycle time, receipt to approval (output) | Average 4 days; I-MR chart limits from post-pilot data | All invoices, plotted daily | Daily, reviewed weekly | AP manager | Investigate any special-cause signal within 2 working days and log root cause |
| Invoice processing | Rework rate (output) | 2% or less; p-chart | All invoices | Weekly | AP manager | Hold a root-cause review; escalate to finance controller if above 3% for 2 weeks |
How it works day to day: The supervisor checks overdue exceptions each morning. Every Friday, the AP manager reviews both control charts in a 15-minute huddle. If the cycle-time chart shows eight points in a row above the centre line, the response plan starts straight away rather than waiting for the monthly review.
Notice that three of the five rows track inputs rather than outputs. That is deliberate. If checklist completion drops, the team can act before rework and cycle time start to climb.When a signal appears, the team uses simpleroot cause analysis techniques before changing the process.
Project Closure and Benefit Tracking
A project is not finished when the solution goes live. It is finished when the team can show the gains are stable and the benefits are real.
Confirm the improvement with data: Compare performance using the same measures set in theDMAIC Measure phase, such as Cp, Cpk, DPMO, yield or cycle time. Depending on the data, that may include process capability (Cp and Cpk), sigma level, defects per million opportunities (DPMO), yield or cycle time. If you need a refresher on these, our guide tocommon Six Sigma metrics explains each one. Where possible, use a hypothesis test to show the change is statistically significant and not just chance.
Separate hard and soft benefits: Hard benefits show up directly in the financial statements, such as lower material cost, reduced overtime or captured early-payment discounts. Soft benefits are real but harder to price, such as better customer satisfaction, freed-up staff time or lower risk. Report both, but label them clearly.
Set up benefit tracking: Savings estimated at the end of a pilot are only a forecast. Many organisations track benefits for a set period after closure, commonly 6 to 12 months, and compare actual results against the baseline. The process owner provides the operating data and finance confirms the money.
Close the paperwork: A typical closure pack includes:
- The finalSix Sigma project charterwith actual results against the original goals
- The signed control plan and response plan
- Updated SOPs and training records
- A benefit summary agreed with finance
- Lessons learned and ideas for follow-on projects
Store the pack in a shared library so other teams can reuse proven fixes.
Control Phase Tollgate Review
Each DMAIC phase ends with a tollgate review, a short meeting where the project sponsor checks the work before giving approval to move on. The Control tollgate is the final one, so approval here means the project is formally closed.
The sponsor, process owner, project lead and often a Master Black Belt or champion attend. See how theseSix Sigma roles and responsibilities fit together. Finance usually joins to confirm the benefit figures. Questions commonly asked include:
- Is the improved process stable, and do the control charts show it?
- Has the improvement been confirmed with data compared to the baseline?
- Is the control plan complete, with clear owners, frequencies and response actions?
- Are SOPs updated and has everyone who runs the process been trained?
- Has the process owner formally accepted ownership?
- Have the financial benefits been validated by finance?
- What lessons and opportunities to replicate the solution have been recorded?
If the answers are weak, the sponsor can keep the project open until the gaps are fixed. Two more weeks now beats watching the gains fade after sign-off.
Sustaining Gains After the Project
The tollgate closes the project, but the process keeps running. These habits help improvements last long after the project team has disbanded.
- Build reviews into existing routines: Add the control chart to the team's daily huddle or weekly operations meeting rather than creating a separate review that people will skip. When the measures sit alongside everyday targets, they get attention.
- Run regular process audits: Layered process audits, where supervisors and managers check a few items at different intervals, confirm the standard is still being followed.
- Update the control plan as things change: New software, staff, suppliers or products all affect a process, so revise the plan whenever the process changes, not just once a year.
- Train new joiners on the standard: Turnover is one of the biggest threats to sustained gains. Make the updated SOP part of onboarding so new people learn the improved method from day one.
- Link measures to goals: A measure that sits in the process owner's objectives stays on their radar.
- Replicate what works: If the solution worked in one site or team, look for similar processes elsewhere. Spreading a proven fix is often faster and cheaper than starting a new project.and it builds a culture of continuousprocess improvement.
Common Control Phase Mistakes
Even well-run projects can stumble at the finish line. Watch out for these common errors.
- Treating the control plan as paperwork: A plan filed away after the tollgate protects nothing.
- No named owner: "The team" is not an owner. Every measure and response action needs a specific person or role.
- Vague response plans: "Investigate the issue" is not a plan. State the trigger, the first step, who acts and by when.
- Using old control limits: Limits based on pre-improvement data are too wide and hide new problems.
- Mixing up control limits and specification limits: A process can be stable yet fail customer needs, or meet needs while being unstable.
- Reacting to every point: Adjusting the process after normal variation, known as tampering, usually makes things worse.
- Monitoring only outputs: By the time the output shows a problem, defects have already happened. Track key inputs too.
- Stopping monitoring too early: Many processes look stable for a few weeks and then drift.
- Skipping training for new joiners: New staff copy whoever sits next to them, old habits included.
- Claiming benefits without finance: Unchecked savings figures damage the credibility of the whole programme.
Conclusion
The DMAIC control phase is where improvement turns into lasting performance. Standardise the new method, write a control plan that people actually use, monitor with control charts, agree clear response actions and hand ownership to someone who will keep it alive. Then confirm the benefits with data before closing the project.
None of this is complicated. What makes the difference is discipline: clear owners, simple routines and acting early on real signals.
If you want hands-on practice building control plans, choosing the right control chart and running tollgate reviews, SimpliaxisLean Six Sigma Green Belt training covers the full DMAIC cycle with practical exercises and case studies.





 Lowest-Price Challenge












 Personalized Path



.webp)


 USA
 Canada
 India
 UK
 Australia
 Singapore


