


 Call Us




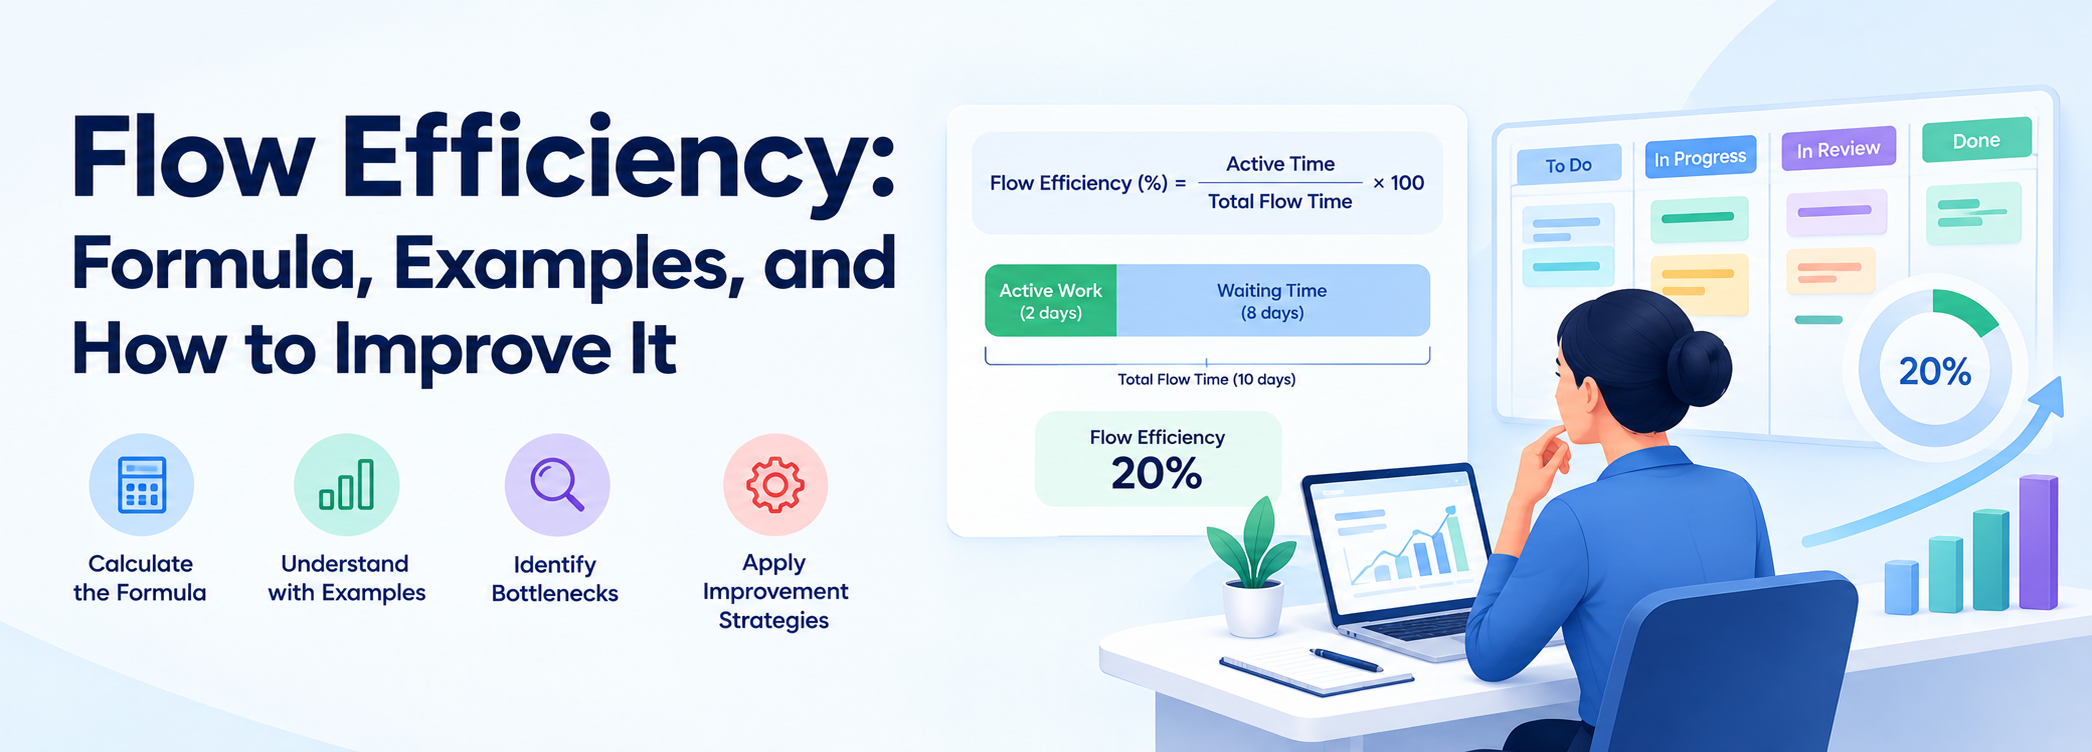
Why is work taking longer than expected, even when a team stays busy? That’s where flow efficiency helps you find out. It is the percentage of an item’s total flow time spent on active work. The formula is
Flow Efficiency (%) = active time ÷ total flow time × 100.
For example, an item with 2 days of active work and 8 days of waiting has a flow efficiency of 20%.
In environments using the Scaled Agile Framework (SAFe), teams can use flow metrics like flow efficiency to identify bottlenecks, reduce delays, and improve the delivery of value. The metric helps teams identify delays caused by queues, handoffs, blockers, and dependencies. Use it to diagnose workflow problems and track improvement, not to rate individual performance.
Infographic (1) Flow Efficiency
Key Highlights of Flow Efficiency
- Flow efficiency measures the percentage of total flow time spent on active work.
- Total flow time includes both active work and waiting time within the chosen measurement boundaries.
- Calculate the metric consistently, using the same time units and workflow definitions.
- There is no universally accepted flow efficiency percentage that applies to every team.
- Queues, handoffs, blockers, dependencies, and excessive work in progress can increase waiting time.
- Limiting WIP and addressing the longest delays can help improve flow efficiency.
- Treat the result as an estimate because workflow states and timestamps may not capture every delay accurately.
- Use flow efficiency alongside flow time, throughput, and quality measures rather than as a standalone performance target.
Introduction
Here is a question worth asking your team: how long does a one-hour fix take to reach your customers? If the honest answer is "a week or two," you are not alone. And the reason is probably not slow people.
Let us take a hypothetical example: a bug fix that takes 90 minutes to write. It then waits for a reviewer, a test environment, and a release window, and lands in production 11 days later. For most of those 11 days, nobody touched it.
That gap between working time and waiting time is exactly what flow efficiency measures. It answers a blunt question: of everything an item goes through, how much is real work, and how much is just waiting?
In this guide, you will learn the flow efficiency formula, work through three examples, and find out what a "good" percentage really looks like (it is less clear-cut than most articles claim). Moreover, you will also get a 30-day plan to improve it.
What Is Flow Efficiency?
Flow efficiency is a Lean metric that measures the proportion of a work item's total flow time spent on active work. It helps teams understand whether delays come from the work itself or from the time items spend waiting between activities.
For example, a feature may require three days of development, one day of testing, and one day of review. If it also spends ten days waiting for reviews, environments, approvals, and release, its total flow time is much longer than its active work time.
By separating active time from waiting time, teams can identify where work gets delayed and decide which parts of the workflow need improvement. Flow efficiency is therefore a diagnostic metric, not a measure of individual productivity.
Definition: Active Time vs. Wait Time
Active time is the time spent performing the work required to move an item towards completion. Examples include writing code, conducting tests, reviewing a change, and completing an agreed task.
Waiting time is the time an item spends idle between activities. This includes waiting in a queue, waiting for an approval, being blocked by a dependency, or waiting for access to a shared environment.
Total flow time is the sum of active time and waiting time within the chosen workflow boundaries.
Total flow time = Active time + Waiting time
Let us consider a task that requires six hours of active work but takes 24 hours to complete. The remaining 18 hours are waiting time if the entire elapsed period falls within the measurement boundaries.
The distinction depends on how the team records its workflow states. An item marked "In Review" may be actively reviewed for an hour and then sit untouched for several hours. Treating the entire period as active would overstate flow efficiency.
Why Work Spends Most of Its Life Waiting
Work often waits because demand and available capacity do not match at every stage of delivery. A developer may finish a task before a reviewer is available. A tester may have to wait for an environment, while a completed feature may sit until the next release window.
These delays accumulate across the workflow. Each wait may seem small, but several handoffs can add days to the total delivery time. For example, a feature that needs four days of active work might still take three weeks to reach production. In this case, the main opportunity may not be to speed up development. It may be to reduce the time the feature spends waiting for reviews, testing, decisions, or deployment.
Flow Efficiency vs Resource Efficiency
Resource efficiency and flow efficiency examine different aspects of delivery.
Resource efficiency focuses on how much of a person's or team's available capacity is being used. Flow efficiency focuses on how much of a work item's total flow time is spent on active work.
Keeping everyone fully occupied may appear efficient, but it can leave no capacity to absorb urgent work, resolve blockers, or respond to unexpected changes. When a shared resource becomes a bottleneck, incoming work may accumulate in a queue.
Flow efficiency encourages teams to examine how work moves through the system instead of focusing only on how busy people are.
| Comparison | Resource efficiency | Flow efficiency |
| Main question | How much available capacity is being used? | How much of an item's total flow time is active work? |
| Primary focus | People, teams, or resources | Work items and workflow |
| Potential problem when optimized in isolation | High utilization can contribute to queues and delays | A higher percentage may still hide quality or delivery problems |
| Practical use | Capacity and resource planning | Identifying waiting time and workflow bottlenecks |
This does not mean resource utilization is unimportant. Rather, teams should balance capacity use with the need to move work through the system predictably. Protecting capacity at bottlenecks can help reduce waiting without requiring every person to remain busy at all times.
Where Flow Efficiency Fits Among Flow Metrics
Flow efficiency is one of the six flow metrics in SAFe’s Measure and Grow guidance. The six metrics are flow distribution, flow velocity, flow time, flow load, flow efficiency, and flow predictability.
Each metric answers a different question. Flow velocity tracks completed work, flow load describes work in progress, and flow time measures how long work takes to move through the system. Flow distribution shows how work is divided across different types, while flow predictability examines how reliably teams meet their planned outcomes.
Flow efficiency adds another perspective by showing how much of the total flow time is spent on active work rather than waiting.
Together, these metrics help teams and leaders understand delivery performance more fully. Flow efficiency is particularly useful when a team wants to investigate why items take so long to complete.
How Flow Efficiency Relates to Little's Law
Little's Law describes the relationship between average work in progress (WIP), average throughput, and average flow time in a stable system:
Average flow time = Average WIP ÷ Average throughput
Flow efficiency is not part of Little's Law itself. However, it helps explain how the resulting flow time is divided between active work and waiting time.
Consider a team that has an average of 40 work items in progress and completes 10 items per week. Under the assumptions of Little's Law, its average flow time is four weeks, or approximately 20 working days when a five-day working week is used.
If an item requires three days of active work, its illustrative flow efficiency is:
Flow efficiency = 3 ÷ 20 × 100 = 15%
Now suppose the team reduces its average WIP to 25 while maintaining throughput at 10 items per week. The implied average flow time becomes 2.5 weeks, or approximately 12.5 working days.
If active work still takes three days, the illustrative flow efficiency becomes:
Flow efficiency = 3 ÷ 12.5 × 100 = 24%
This example shows how lower WIP can be associated with shorter flow time and higher flow efficiency when throughput and active work time remain unchanged. In a real workflow, those conditions may change, so teams should measure the result rather than assume the improvement will occur automatically.
The Flow Efficiency Formula
The flow efficiency formula needs only two numbers per item, and you can pull both from board history.
Active Time Divided by Total Flow Time
Flow efficiency (%) = (Active time ÷ Total flow time) × 100
Active time is the time spent performing the agreed work activities. Total flow time is the elapsed time between the selected start and end points.
For example, if an item requires 2 days of active work and takes 10 days to complete:
Flow efficiency = (2 ÷ 10) × 100 = 20%
The item has eight days of waiting time within the measured period.
Before calculating flow efficiency, decide whether your team will count calendar time or working time. Calendar time includes weekends and holidays; working time excludes non-working periods according to your chosen convention. Either approach can be used, provided the definitions remain consistent, and the results are interpreted accordingly.
Also specify whether the measurement starts when work is requested, committed, or pulled into the workflow, and whether it ends at completion, release, or deployment. These choices affect the result.
What Counts as Active vs. Waiting
Classify workflow states according to the work being performed, rather than relying only on the name of a board column.
Active states may include development, testing, and a review that is actually in progress. Waiting states may include:
- Ready for review, when nobody is reviewing the item
- Waiting for testing or a shared test environment
- Blocked by a dependency or unresolved decision
- Awaiting approval or release
- Sitting in a queue until someone is available
Some states require additional care. For example, "In Review" may include both active review time and time spent waiting in a reviewer's queue.
If your tool allows it, separate "Ready for Review" from "Review in Progress." The same principle applies to testing, approval, and deployment.
Where the tool cannot distinguish active work from waiting, document the limitation. Your result will be an estimate based on the available data, not an exact measurement of every minute spent working.
Flow Efficiency Calculation: Three Worked Examples
The following flow efficiency examples show how to calculate the percentage for a single item, compare multiple items, and identify the largest source of waiting in a delivery workflow.
Example 1: Calculating flow efficiency for one item
A work item takes 10 days to complete. It requires 2 days of active work and spends the remaining 8 days waiting.
Flow efficiency = (2 ÷ 10) × 100 = 20%
The result means that 20% of the item's total flow time was active work, while the remaining 80% was waiting time within the chosen boundaries.
Example 2: Calculating flow efficiency for multiple items
Suppose a team reviews five completed items.
| Item | Active days | Total days | Flow efficiency |
| A | 2 | 10 | 20.00% |
| B | 3 | 6 | 50.00% |
| C | 1 | 14 | 7.10% |
| D | 4 | 8 | 50.00% |
| E | 2 | 12 | 16.70% |
| Total | 12 | 50 | 24.0% (pooled) |
The pooled flow efficiency is calculated by dividing the total active time by the total flow time:
Pooled flow efficiency = (12 ÷ 50) × 100 = 24%
The simple arithmetic mean of the five individual percentages is approximately 28.8%.
These figures differ because the pooled calculation accounts for the total time spent on all five items, whereas the simple average gives every item equal weight regardless of its duration.
Both methods can describe a dataset, but they answer slightly different questions. If you use the pooled method, state that clearly and apply it consistently when tracking trends.
Example 3: Identifying waiting time at each stage
A feature request moves through the following workflow.
| Stage | Days | Type |
| Ready, waiting to be picked up | 4 | Waiting |
| Development | 3 | Active |
| Waiting for review | 3 | Waiting |
| Code review | 1 | Active |
| Waiting for a test environment | 5 | Waiting |
| Testing | 2 | Active |
| Waiting for the release window | 4 | Waiting |
| Total | 22 | 6 active, 16 waiting |
Flow efficiency = (6 ÷ 22) × 100 = 27.3%
The table shows that the test environment is the longest individual waiting stage, at five days. If the team reduces this wait to one day and all other durations remain unchanged, total flow time falls to 18 days.
The revised flow efficiency would be:
Flow efficiency = (6 ÷ 18) × 100 = 33.3%
This is a hypothetical illustration, not a guaranteed outcome. It demonstrates how a stage-by-stage breakdown can help a team identify where to investigate first.
What Is a Good Flow Efficiency?
There is no universally accepted flow efficiency percentage that applies to every team or workflow. A useful result depends on the type of work, the measurement boundaries, the workflow design, and how accurately active and waiting time are recorded.
Instead of treating a particular percentage as the ideal, teams should establish a baseline, compare similar work items, and investigate changes over time.
Flow Efficiency Benchmarks: What the Data Shows
You may encounter guidance suggesting that flow efficiency often falls between 5% and 15%, or that higher percentages indicate better performance. These figures should be interpreted cautiously because teams do not always use the same definitions or measurement methods.
Different published sources report different ranges. Flow Efficiency: The Hidden Metric Exposing Your Product Bottlenecks”. Check that this is the November 2025 article with the 15–25% estimate, while an analysis of 63 teams associated with ASOS reports values ranging from 9% to 68%, with an average of 35%.
These figures illustrate variation rather than establish a universal standard. Differences in workflow boundaries, the types of items measured, and how teams record active and waiting states can all affect the result.
| Reported reference | Figure mentioned | How to interpret it |
| Commonly repeated Lean and Kanban guidance | 5–15% is often quoted | An informal rule of thumb, not a universal standard |
| Scrum.org article, November 2025 | 15–25% for most product teams, as reported by the article | An attributed estimate that should be read in its original context |
| Analysis of 63 teams associated with ASOS | 9–68%, with a reported average of 35% | A dataset showing variation across the teams studied |
Before using these figures as benchmarks, consult the original sources and check their definitions and methodology. Do not assume that the results are directly comparable.
Board data also has limitations. Items may remain in active columns overnight, and teams may fail to record blocked periods or queue time accurately. As a result, calculated flow efficiency may overstate the proportion of time spent actively working.
For practical decisions, your own consistently measured baseline is more useful than an unsupported industry-wide target.
Realistic Improvement Targets
Set improvement targets based on your current performance and the bottleneck you want to address. For example, if items regularly wait three days for review, the team could experiment with reducing that wait to one and a half days.
Avoid setting an arbitrary flow efficiency target without understanding the workflow. A higher percentage may indicate less waiting, but it does not automatically mean the team is delivering more valuable work or maintaining quality.
The formula can help illustrate the effect of reduced waiting. Suppose an item requires five days of active work and takes 25 days in total. Its flow efficiency is 20%.
If active time remains five days and total flow time falls to approximately 16.7 days, efficiency rises to 30%.
The practical goal is not simply to increase the percentage. It is to remove unnecessary delays while maintaining quality, sustainable workloads, and reliable delivery.
How to Measure Flow Efficiency
Flow efficiency metrics depend on timestamps your tool already records. The Kanban metrics your team already tracks, such as lead time and cycle time and WIP, use the same data.
Choosing Your Start and End Points
Decide where the clock starts and stops before you measure anything. That choice changes the result more than any calculation detail.
- Start at commitment: Count from the moment the team pulls the item into work. This reflects what the team controls.
- Start at request: Count from when someone first asked for it. Backlog waiting is included, so efficiency looks lower, but it matches what the customer experienced.
- End at release: Items that are finished but not deployed are still waiting.
Neither start point is wrong. Choose one, state it beside every chart, and keep it stable. Mixing them across teams is a common reason comparisons fail.
Mapping Active and Wait States
List every column on your board and label each one. Here is a sample map:
| Board column | Classification |
| Backlog ready | Waiting |
| In development | Active |
| Ready for review | Waiting |
| In review | Active |
| Ready for test | Waiting |
| Awaiting release | Waiting |
Without explicit queue columns, waiting hides inside "in progress," and the metric overstates efficiency. Add them before you measure.
Using a Cumulative Flow Diagram
A cumulative flow diagram shows how many items sit in each state over time. If you wonder what a cumulative flow diagram in SAFe terms is, it is a stacked area chart of work by state.
For this metric, look at the bands for waiting states. A band that widens over time means items are piling up there. That is where your waiting time is accumulating.
Common Measurement Pitfalls
Measurement is imperfect, so watch for these traps:
- Stale boards. If people update cards late, active and waiting times blur.
- Weekends counted as active. Items sitting in an active column overnight inflate efficiency.
- Unflagged blockers. Blocked work appears active unless someone marks it.
- Averaging percentages. As Example 2 shows, this skews the result.
- Chasing precision. Logging every pause costs more effort than it returns. Aim for a consistent, good-enough estimate.
Read More: software measurement principles
Why Low Flow Efficiency Happens
Low scores are rarely about people. Waiting is built into how work is organized, and it usually has one of a few sources. This table shows what each looks like on a board.
| Cause | What you see | First thing to check |
| Queues and handoffs | Wide bands in "ready for..." columns | Longest queue, in days |
| Too much WIP | Many cards in progress, few finishing | Items started vs finished per week |
| Blockers | Blocked tags and aging cards | Total blocked days |
| Dependencies | Cards waiting on other teams | Cross-team dependencies per item |
Queues, Handoffs and Dependencies
Every handoff creates a queue. Work passes from design to development to testing to operations, and each team has its own backlog.
Dependencies add more. If your item needs another team's output, it waits for that team's priorities, not yours. The more specialists a workflow involves, the more queues it holds.
Too Much Work in Progress
When a team starts more than it finishes, items sit idle while people switch between tasks. High WIP is the main driver of long flow time under Little's Law, which is why it is often the first thing to fix. Work "in progress" that nobody is touching is simply waiting.
Blockers and Waiting on Others
Blocked items wait for answers, approvals, access, data, or decisions. A one-day blocker on a two-day task halves efficiency instantly. Decisions that bounce up an escalation chain are a frequent offender.
How to Improve Flow Efficiency
To improve flow efficiency, shrink waiting time, not working time. Telling people to work faster rarely helps, because the delay lives between tasks. Start with the longest wait on your board, and run one experiment at a time.
Limiting WIP
Set a work-in-progress limit slightly below your current average, and hold it for a few weeks. Set a work-in-progress limit slightly below your current average. WIP limits and flow are core topics in Applying Professional Kanban (APK).Teams finish more and start less, so items spend less time idle. Combine it with a "stop starting, start finishing" rule: when a column is full, help finish something before pulling new work.
Reducing Handoffs and Wait States
Look for steps that exist only to pass work between groups. Options include cross-functional teams, pairing across roles, and agreeing standards so fewer approvals are needed. Where a handoff must stay, shorten the queue: for example, agree that reviews start within four working hours.
Attacking Blockers Quickly
Flag blockers on the board, discuss them at the Daily Scrum, and give each one an owner. Track blocked time as its own number, because it shows how much waiting comes from outside the team.
Making Queues Visible
Waiting is difficult to reduce when it is hidden inside broad workflow states. Use explicit queue states where practical, and make the age of unfinished items visible. For example, separating "Ready for Review" from "Review in Progress" helps the team see whether delays occur before a reviewer begins work or while the review is being completed.
Review the oldest waiting items regularly. Ask why each item has not progressed, what it needs next, and whether the delay is recurring. These conversations help the team prioritize the most important bottlenecks instead of relying on the overall flow efficiency percentage alone.
A 30-Day Plan to Improve Flow Efficiency
Infographic: 30-Day Plan to improve Flow Efficiency
A short improvement cycle helps teams move from measurement to action without attempting to change the entire workflow at once. The following plan provides a starting point for one team.
| Week | Focus | Output |
| 1 | Map workflow states and identify missing queue states | A documented workflow with clearer active and waiting definitions |
| 2 | Review a sample of 8–10 completed items | A baseline and a list of the most significant waiting stages |
| 3 | Test one change aimed at the largest bottleneck | An improvement experiment, such as a WIP limit or review agreement |
| 4 | Measure a new sample and review the results | A decision to retain, adjust, or stop the experiment |
A sample of 8–10 items is a practical starting point, not a statistically reliable benchmark for every workflow. In the fourth week, examine the direction of the results, the reasons for waiting, and any changes in throughput or quality.
If the outcome is unclear, collect more data before drawing conclusions. Once the team understands the effect of the first experiment, repeat the cycle with the next important bottleneck.
Flow Efficiency in SAFe and Kanban
Flow efficiency can be measured in Kanban workflows and used as part of the broader flow metrics in SAFe. In both settings, the calculation depends on having clear workflow boundaries and sufficiently reliable information about active work and waiting time.
Kanban [a] boards can help teams visualize queues, track work items, and identify bottlenecks. However, a board with workflow columns does not automatically provide an accurate flow efficiency figure. Teams must distinguish active activities from periods when work is waiting.
In SAFe, flow efficiency provides another perspective on how work moves through the delivery system. It can help teams investigate delays that contribute to long flow times, while other flow metrics provide context about workload, delivery speed, distribution, and predictability.
Its Role in the SAFe Flow Metrics
Flow efficiency is one of the six SAFe flow metrics, alongside flow distribution, flow velocity, flow time, flow load, and flow predictability.
These metrics offer complementary perspectives on delivery. Flow time helps teams understand how long work takes to move through the system, while flow efficiency helps explain how much of that time is spent on active work.
For example, if flow time increases while active work time remains relatively stable, the team may need to investigate growing queues, blockers, or dependencies. Flow efficiency helps frame that investigation, but the team should use workflow history and other metrics to identify the underlying cause.
The value comes from interpreting the metrics together rather than optimizing one percentage in isolation.
Improving Flow at Team and ART Level
At team level, flow efficiency improvements may involve reducing review delays, controlling WIP, making blockers visible, and clarifying how work moves from one stage to the next.
At Agile Release Train (ART)[b] level, delays may extend across multiple teams. Shared environments, cross-team dependencies, architectural constraints, and slow decisions can all affect the time needed to deliver a feature.
In these situations, improvement may require coordination across teams rather than a local process change. Teams can map dependencies, clarify ownership, and investigate where work accumulates across the broader value stream.
When comparing results, use consistent measurement boundaries and comparable work items. A team measuring stories and an ART measuring features may produce different percentages because the units of work and workflows differ.
Read more: value stream mapping to see where work accumulates across the value stream.
Flow Efficiency in Scrum and Other Agile Teams
Flow efficiency can help Scrum teams understand how much time work spends in active activities versus waiting between them. A story may require only a few days of active work but remain unfinished because it is waiting for review, testing, clarification, or a dependency.
Sprint[c] boundaries can also affect how work moves through a workflow. For example, an item may wait for a review, approval, or release activity even after its development work is complete.
Scrum teams can investigate these delays by making workflow states visible, clarifying the Definition of Done, and addressing work that remains blocked or unfinished. Where appropriate, team members can collaborate on reviews and testing instead of starting more work.
The objective is not to maximize flow efficiency at the expense of quality or Scrum's commitments. It is to understand where work waits and improve the team's ability to deliver valuable, usable increments.
The Scrum Master's Role in Flow Efficiency
A Scrum Master can help a team understand where work gets delayed and facilitate improvements to its workflow. The role is not to set an arbitrary flow efficiency target or use the metric to assess individual performance. Instead, the Scrum Master helps the team inspect its process, identify obstacles, and experiment with improvements.
Practical responsibilities include:
- Make workflow data visible: Help the team review active time, waiting time, and recurring delays during appropriate team discussions.
- Facilitate improvement experiments: Support the team in selecting a bottleneck, agreeing on a change, and reviewing the result.
- Encourage focus: Help the team examine excessive WIP and improve collaboration around unfinished work.
- Address systemic impediments: Facilitate conversations about cross-team dependencies, shared resources, and slow decision-making.
- Promote responsible measurement: Explain that flow efficiency describes a workflow, not an individual's productivity.
Scrum Masters who want to develop their skills in a scaled Agile environment can explore SAFe Scrum Master Certification Training, which is relevant to facilitation and improvement across a Release Train.
Common Mistakes and Best Practices
Common Mistakes
Most problems come from misreading the number. Avoid these:
- Quoting a single benchmark: Compare against your own history instead.
- Inconsistent definitions: If teams classify states differently, comparisons mean nothing.
- Judging individuals: The metric describes the system, not a person.
- Chasing 100%: Some waiting is healthy, such as buffers that protect against variability.
- Using it alone: Pair it with flow time, throughput, and quality data.
Where the Metric Falls Short
Flow efficiency is useful, but it has limits. It says nothing about whether the work was valuable, and teams can inflate it by leaving items in active columns. The ASOS author also points out that tracking waiting precisely would demand many extra board updates for every item, which costs focus and adds noise.
Treat it as one view among several. The same analysis suggests work item age and blocked-work metrics as alternatives or complements. Work item age shows how long each unfinished item has been in progress, so you can spot stalled work today, not weeks later.
Best Practices
- Write down definitions: Record which states are active and which are waiting.
- Add queue columns first: Measurement is meaningless without them.
- Choose one calculation method: Use the pooled ratio or the average, and stay with it.
- Track trends monthly: One reading says little, while a trend shows direction.
- Pair data with conversation: Ask the team where waiting hurt most.
- Change one thing at a time: You can then see what worked.
Conclusion
So, where does your work spend its time: being worked on, or waiting its turn? If you keep only three things from this guide, make them these. First, flow efficiency is active time divided by total flow time, and most teams find the number is lower than they expected. Second, nobody can hand you a universal "good" percentage, so your own baseline and trend are the benchmark. Third, the quickest wins come from cutting waiting, not speeding up work: limit WIP, shorten your longest queue, and clear blockers fast.
Ready to try it? Pick one team, add queue columns to its board, and measure ten finished items. You will likely spot the biggest delay within a week. Fix that one, then measure again.
If you want to coach teams through this kind of improvement, Simpliaxis' SAFe[d] training covers these practices in the context of a Release Train.









 Lowest-Price Challenge












 Personalized Path



.webp)


 USA
 Canada
 India
 UK
 Australia
 Singapore


