


 Call Us




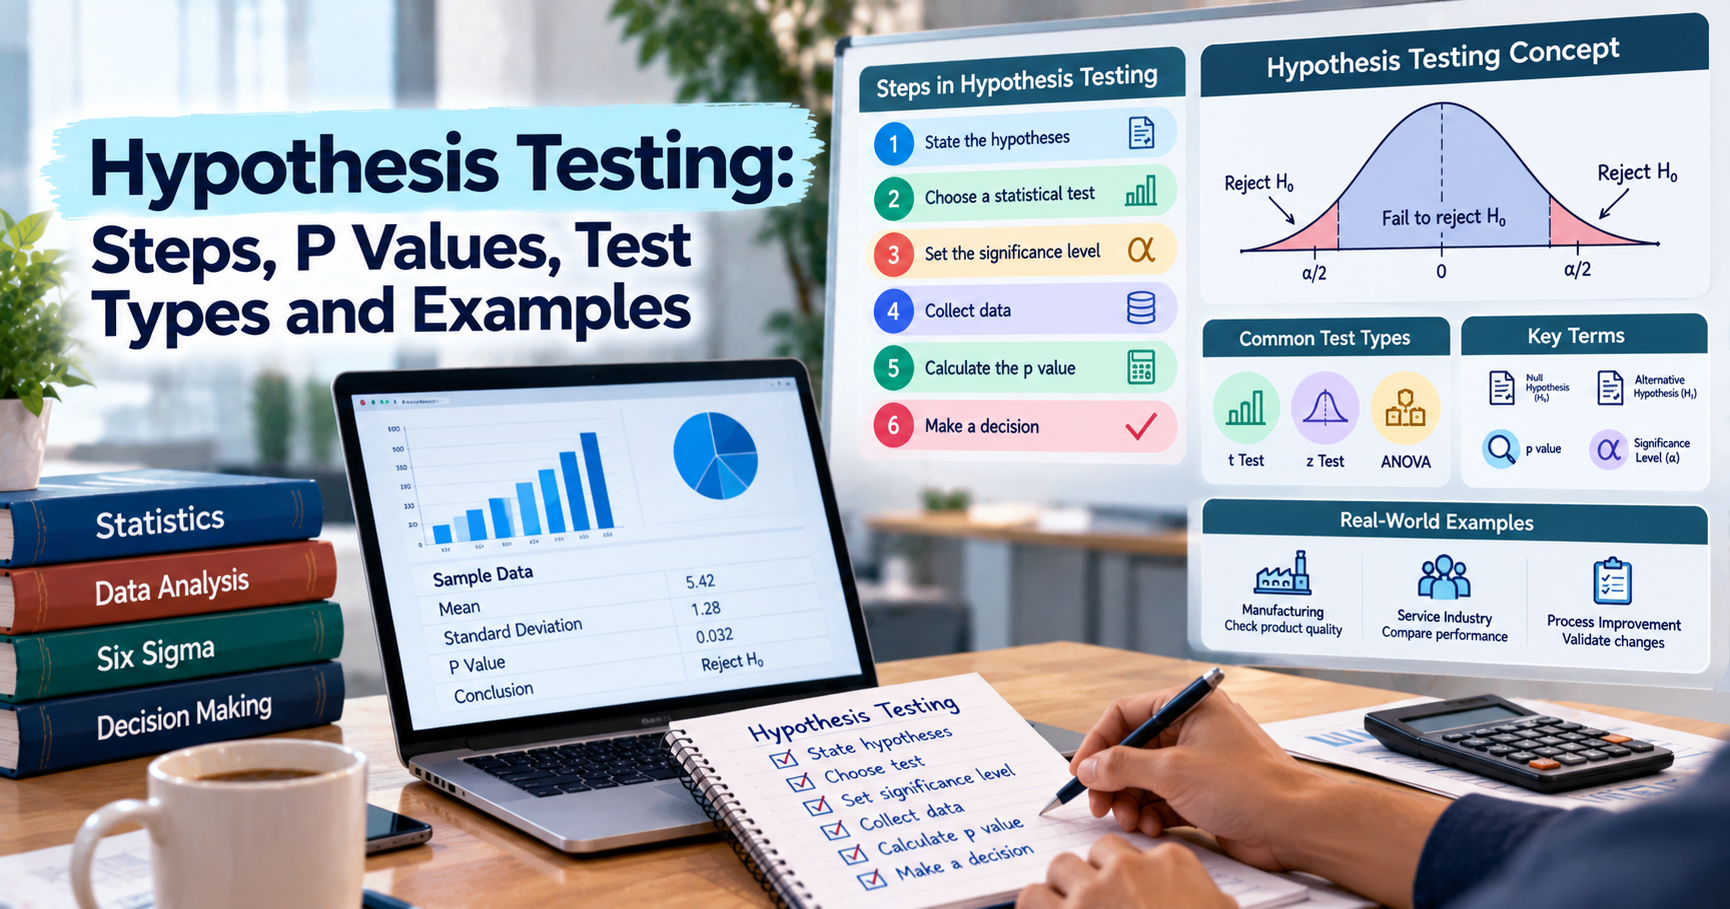
Hypothesis Testing: Steps, P Values, Test Types and Examples
Hypothesis testing is a statistical method used to check whether a claim about a process, product, or population has enough evidence to support it. It compares sample data against an initial assumption called the null hypothesis. The results help determine whether the observed difference is meaningful or could have happened by chance.
The main hypothesis testing steps include stating the hypotheses, choosing a suitable statistical test, setting a significance level, collecting data, calculating the p-value, and making a decision. Common tests include the t-test, z-test, and ANOVA. In Six Sigma, hypothesis testing helps teams check possible causes of problems and make decisions based on data rather than guesswork.
Key Highlights of Hypothesis Testing
- Hypothesis testing is a method of making decisions using data.
- The null hypothesis is usually that there is no difference, no effect, or no change.
- The alternative hypothesis suggests that a difference or effect exists.
- A p-value helps measure how unusual the observed results would be if the null hypothesis were true.
- The significance level, often set at 0.05, provides a cut-off for making a statistical decision.
- The t-test, z-test, and ANOVA are common types of hypothesis tests.
- Type I and Type II errors can occur when making decisions from sample data.
- In Six Sigma, hypothesis testing helps teams check possible root causes and support process improvement.
Introduction
Imagine you manage a factory that makes metal parts. The required length of each part is 10 cm. We’ve had a few customers recently report that some parts do not fit. Your team checks a few pieces and sees that they are a little off from their target lengths.
Does that mean the whole production process is wrong? Not necessarily. When products are manufactured, there can be a slight difference naturally. But a persistent difference might be a sign of something that needs fixing.
This is where hypothesis testing becomes useful.
Instead of changing the production process based on a few observations, you can collect data and use a statistical test to check whether the difference is large enough to count as evidence of a real problem.
The same idea works in other situations. A service team might want to know whether a new training program reduces call handling time. A hospital may want to compare patient waiting times before and after a process change. A business might check whether a new method reduces errors in its daily work.
In both cases, the aim is to reach a decision based on evidence.
Hypothesis testing is an important part of what is Six Sigma because it helps teams move beyond assumptions and check what the data actually shows.
This guide is a simple explanation of hypothesis testing. It includes the main concepts, the steps, the common tests, real-world examples, and the role in the Six Sigma Analyze phase.
What Is Hypothesis Testing?
Hypothesis testing is a statistical method used to validate a claim about a population or process. It uses information from a sample to decide whether there is enough evidence to reject an original assumption.
A population is the entire group of people that you want to draw conclusions about. For example, if a factory produces 50,000 bottles in a day, all the bottles are the population. Checking every bottle may take too much time, so the team can select a sample and measure it.
The results of this sample help the team understand what might be happening across the entire production process.
According to the basic approach explained in the NIST e-Handbook: statistical tests, a statistical test uses sample results and a chosen decision rule to assess a claim.
The hypothesis testing statistics are the test statistic, p-value, and significance level. Together, these help you decide whether or not the results provide enough evidence to reject the original assumption.
But hypothesis testing doesn't prove that a claim is absolutely true or false. It helps you make a decision while accounting for uncertainty in the data.
What is Null Hypothesis?
The starting point of a statistical test is the null hypothesis. It is usually written as H₀ and often states that there is no difference, no effect, or no change.
For example, a company advertizes that its bottle-filling machine fills an average of 500 ml of liquid per bottle.
The null hypothesis can be written as:
H₀: The average bottle fill is 500 ml.
This statement is the basis of the test. The team collects sample data and runs tests to see if the results provide enough evidence to reject the claim.
A null hypothesis doesn’t mean that nothing is necessarily going on. It is simply the statement being tested.
Here is another example of a null hypothesis:
H₀: A new employee training program does not change the average time taken to handle a customer call.
The team can test this assumption by comparing call handling times before and after the training.
Writing the null hypothesis clearly is important because the test you use must match the question you want to answer. If the original claim is about an average, the hypothesis should be about the average of the population in question.
Alternative Hypothesis Explained
The alternative hypothesis. This is the opposite statement to the null hypothesis. It is denoted as H 1 or H a. It means there is a difference, change, or effect.
Using the bottle filling example, the hypotheses could be:
- Null hypothesis (H₀): The average bottle fill is 500 ml.
- Alternative hypothesis (H₁): The average bottle fill is not 500 ml.
State the alternative and null hypothesis in a way that is consistent with the question being asked.
If the team is only interested in whether the average fill is different from 500 ml then the alternative hypothesis can be either higher or lower.
If the team wants to check whether bottles are being underfilled, the alternative hypothesis can state that the average fill is below 500 ml.
The choice depends on the purpose of the test.
For more background on how these statements work, read this guide to a statistical hypothesis test on Wikipedia.
Remember that hypothesis testing does not directly prove the alternative hypothesis. Instead, the test checks whether the sample data provides enough evidence to reject the null hypothesis in its favor.
Key Concepts
Before looking at the hypothesis testing steps, it helps to understand a few terms that appear in most statistical tests.
P Value and Significance Level
The p-value is one of the most important parts of hypothesis testing.
If the test is statistically valid, the p-value tells you the probability of results at least as extreme as the observed results, if the null hypothesis were true.
For example, suppose a factory wants to test whether a machine is filling bottles to the desired average of 500 ml. The team used a significance level of 0.05 and found a p-value of 0.02.
0.02 < 0.05. Therefore, the team rejects the null hypothesis at the selected level of significance.
If the p-value were 0.12, the team would fail to reject the null hypothesis because the result does not meet the selected cut-off.
It is important to understand that a p-value is not the probability that the null hypothesis is true. It also does not tell you the size or business importance of a difference.
The p-value significance level comparison helps you make a statistical decision, but you still have to think about the size of the difference and its practical impact.
The level of significance [represented by α (alpha)] is determined before looking at the results. Typical values are 0.05, 0.01, 0.10. A value of 0.05 means that the test has a 5% chance of rejecting a true null hypothesis under the test's assumptions.
This is known as the hypothesis testing level of significance.
For a clearer explanation, refer to Minitab: what is a hypothesis test.
Type I and Type II Errors
Hypothesis testing involves uncertainty because decisions are based on sample data rather than information from every member of a population.
This means two types of errors can occur.
Type I error
A Type I error happens when you reject a null hypothesis that is actually true.
For instance, a factory concludes that the average output of a machine has changed when the process is functioning as it should.
This is also known as a false positive. The significance level controls the probability of a Type I error given the assumptions of the test.
Type II error
A Type II error occurs when you do not reject a null hypothesis that is actually false.
Suppose a machine is consistently underfilling bottles, but there isn’t enough sample data to identify the problem. The team may continue using a process that needs attention.
This is called a false negative.
Both errors count. Type I error can result in unnecessary changes, extra cost, or lost time. A Type II error may allow an actual problem to continue.
The balance will depend on circumstances. For example, a quality issue with product safety may require a different level of caution than a minor difference in the appearance of packaging.
Power and Sample Size
The power of a test is the probability that it will correctly reject a false null hypothesis for a specified alternative. It is calculated as 1 minus the probability of a Type II error.
A more powerful test is more likely to detect a real difference of the size that the analysis is designed to find.
The sample size is important here. If you test just five products from a large production line, you could miss a problem that affects a small share of the output. A larger, properly selected sample can provide more information.
However, a larger sample is not necessarily better if the data is poorly collected. The sample must be representative of the population, and the measurements must be reliable.
When planning a test, teams should consider the expected size of the difference, the amount of variation in the data, the significance level, and the desired power.
For example, a team might want 80% power for a test to detect a meaningful change. This means that when the relevant assumptions hold, the test is 80% likely to detect that specified effect.
The required sample size depends on the test and the size of the effect you want to find. Planning ahead can help avoid gathering too little data and spending more time and money than necessary.
One-Tailed vs Two-Tailed Tests
The direction of the alternative hypothesis determines whether you use a one-tailed test or a two-tailed test.
A one-tailed test checks for a difference in one specific direction.
For example:
- H₀: The average waiting time is 10 minutes.
- H₁: The average waiting time is greater than 10 minutes.
This test focuses on whether the average waiting time has increased.
A two-tailed test checks whether a value is different from the target in either direction.
For example:
- H₀: The average waiting time is 10 minutes.
- H₁: The average waiting time is not 10 minutes.
This test can identify an increase or a decrease.
The choice should come from the original question, not from the results you want to obtain. You should decide the direction before analyzing the data.
A one-tailed test can provide more power in the specified direction, but it will not identify a difference in the opposite direction as evidence for the stated alternative.
A two-tailed test is useful when both increases and decreases matter. For example, a factory may need to identify whether a machine's output has moved away from its target, regardless of the direction.
Hypothesis Testing Steps
The hypothesis testing steps provide a clear way to move from a question to a decision. Following them in order helps prevent mistakes and makes the results easier to explain.
1. State the Hypotheses
Start by defining the problem you want to investigate.
Suppose a call center wants to check whether a new training program has changed the average time agents spend handling calls.
The hypotheses could be:
- H₀: The training program has not changed the average call handling time.
- H₁: The training program has changed the average call handling time.
If the team specifically wants to check whether the training reduced handling time, the alternative hypothesis can be directional.
Be precise about what you are measuring. The hypotheses should focus on a clear population parameter, such as a mean, proportion, or variance.
2. Choose the Test and Alpha
Next, choose a suitable statistical test and set the significance level.
The right test depends on the question, the type of data, the number of groups being compared, and whether observations are independent or related.
For example, a one-sample t-test may be suitable for comparing a sample mean with a target when the population standard deviation is unknown. A two-sample t-test can compare the means of two independent groups.
Set the significance level before examining the results. A value of 0.05 is common, but some situations require a stricter threshold.
You should also consider the required sample size and test power before collecting data.
3. Collect Data and Calculate
Collect the sample according to a clear plan. Check that the measurements are accurate and that the sample represents the process you want to study.
During this stage, a team may review its DMAIC measure phase activities to check whether the data collection method is suitable.
Measurement errors can affect the final result. For example, if two inspectors use different methods to measure the same product, their readings may not be directly comparable.
A measurement system analysis can help assess whether the measurement process is reliable enough for the study.
After collecting the data, calculate the test statistic using the selected method. The test statistic summarizes how far the sample result is from what the null hypothesis predicts, relative to the expected variation.
The test statistic is then used to obtain the p-value or compare the result with a critical value.
4. Decide and Interpret
Compare the p-value with the significance level.
- If the p-value is less than or equal to alpha, reject the null hypothesis.
- If the p-value is greater than alpha, fail to reject the null hypothesis.
Suppose alpha is 0.05 and the p-value is 0.03. The result is statistically significant at the 5% level, so the team rejects the null hypothesis.
However, if the p-value is 0.08, the team fails to reject the null hypothesis at that level.
The second result does not prove that no difference exists. It means the evidence is not strong enough to reject the null hypothesis using the chosen rule.
The team should also consider the size of the effect, a suitable confidence interval, the quality of the data, and the practical consequences before deciding what to do next.
Common Hypothesis Tests
The t-test
A t-test is commonly used to compare means. It is particularly useful when the population standard deviation is unknown, and the assumptions of the test are appropriate.
For example, a quality team may use a one-sample t test to check whether the average weight of packaged goods differs from the target weight.
A paired t test may be used when the same employees are measured before and after a training program. A two-sample t test is useful when comparing two independent groups.
The z-test
A z-test uses the standard normal distribution to evaluate a statistical claim. It is commonly used for certain tests involving means or proportions when the required conditions are met.
For a test involving a population mean, knowing the population standard deviation is a key condition for the standard one-sample z test. Other z tests have their own requirements.
ANOVA
ANOVA stands for analysis of variance. It is used to compare the means of three or more groups.
For example, a factory may want to compare the average output of machines operating on three different production lines. Running several separate tests can increase the risk of false positives, so ANOVA provides a way to assess whether there is evidence that at least one group mean differs.
A significant ANOVA result does not automatically tell you which groups differ. Additional comparisons may be needed.
Chi-square test
A chi-square test is useful when working with counts or categories. A quality team could use it to check whether the type of defect is associated with the shift during which a product was made.
The test you select should match the data and the question. The NIST/SEMATECH e-Handbook of Statistical Methods provides further statistical guidance.
Hypothesis Testing Examples
The easiest way to understand hypothesis testing is to see how it works in everyday situations.
Example of a Null Hypothesis in Manufacturing
A factory produces metal rods that should have an average length of 20 cm. The quality manager wants to check whether the production process is meeting this target.
The team selects 40 rods and measures their lengths. The sample average is 19.8 cm.
At first glance, the result suggests that the rods may be shorter than required. But the manager should not immediately conclude that the entire production process is producing undersized rods. Some variation is normal.
The team sets up the hypotheses:
- Null hypothesis (H₀): The population mean rod length is 20 cm.
- Alternative hypothesis (H₁): The population mean rod length is different from 20 cm.
The team chooses a significance level of 0.05 and uses a suitable one-sample t test, assuming the conditions for the test are met.
Suppose the analysis produces a p-value of 0.02.
Since 0.02 is below 0.05, the team rejects the null hypothesis. There is sufficient statistical evidence at the chosen significance level that the population mean rod length differs from the 20 cm target.
The team should then investigate why the difference has occurred. Possible areas to check include machine settings, material variation, tool wear, and measurement accuracy.
The result does not identify the root cause by itself. It only provides evidence that the average length may not match the target.
The manager should also check the size of the difference and its practical importance. A statistically significant result does not automatically mean that every rod is defective or that the process must be stopped immediately.
This is how hypothesis testing supports a more careful quality decision.
Service Process Example
Consider a customer support team that takes an average of 12 minutes to resolve a service request. The manager introduces a new work process and wants to know whether it has reduced the average resolution time.
The team records the resolution times for a suitable sample of requests before and after the change.
The hypotheses are:
- Null hypothesis (H₀): The new process has not reduced the average resolution time.
- Alternative hypothesis (H₁): The new process has reduced the average resolution time.
The team selects a suitable test based on how the data was collected. If the same types of requests are measured in matched pairs, a paired approach may be suitable. If the samples are independent, a different test may be needed.
Suppose the analysis gives a p-value of 0.01 at a significance level of 0.05.
The team rejects the null hypothesis. The results provide statistical evidence that the average resolution time has decreased.
However, the manager should not stop at the p-value.
The next step is to check how much time the process has saved. A reduction of 10 seconds may not make a meaningful difference to customers or operating costs. A reduction of three minutes across thousands of requests could have a much greater impact.
The manager should also check whether the new process affects service quality, customer satisfaction, or error rates.
This example shows why hypothesis testing works best alongside practical knowledge of the process. Statistics help answer the question, while the team decides what the result means for the business.
Hypothesis Testing in the DMAIC Analyze Phase
The DMAIC method stands for Define, Measure, Analyze, Improve, and Control. It is a structured approach used in Six Sigma projects to understand problems, identify causes, test solutions, and maintain improvements.
Hypothesis testing is especially useful during the Analyze phase.
By this stage, the team has defined the problem and collected information about the current process. It now needs to determine which factors may be responsible for the issue.
For example, a factory may be dealing with a high defect rate. Team members might suspect that machine temperature, operator experience, material type, or production shift is affecting quality.
These are possible explanations, not confirmed causes.
Hypothesis testing helps the team check whether the available data supports a particular explanation. This reduces the risk of changing a process based only on personal opinions or assumptions.
Teams can also use other Six Sigma Green Belt tools to organize their investigation and understand the data.
Turning Root Cause Theories Into Tests
Suppose a production team believes that defects are more common on the night shift than on the day shift.
The team can collect defect data from both shifts and define a suitable statistical test.
The null hypothesis might state that the defect proportions are equal across the two shifts. The alternative hypothesis would state that the proportions differ.
A suitable test can then determine whether the observed difference provides enough evidence to reject the null hypothesis.
If the result is statistically significant, the team has a reason to investigate further. It may review staffing, machine settings, material handling, or working conditions.
If the result is not statistically significant, the team should not assume that the shifts are identical. It may need a larger sample, better measurements, or a different way to investigate the problem.
Hypothesis testing can also be used with other Six Sigma methods. A scatter diagram can help teams examine the relationship between two variables, while control charts can help them monitor process behavior over time.
These tools serve different purposes. A scatter diagram can reveal a pattern worth investigating, while hypothesis testing can assess a specific statistical claim. Control charts help distinguish routine process variation from signals that may need attention.
This work supports process improvement by helping teams make changes based on evidence and check whether those changes address the actual problem.
Hypothesis testing is also relevant to the Six Sigma Analyze phase because it helps teams move from possible explanations to conclusions supported by data.
Common Mistakes in Hypothesis Testing
Hypothesis testing is useful, but a mistake in the setup or interpretation can lead to a poor decision. Here are some common problems to watch for.
Choosing the wrong test
A test that does not match the data can produce misleading results. Before selecting a method, check whether you are comparing means, proportions, counts, or relationships between categories. Also consider whether the samples are independent or related.
Using a small or unsuitable sample
A sample that is too small may fail to detect a real difference. A sample that does not represent the population may lead to conclusions that do not apply to the wider process. Plan the sample size and data collection method before starting the test.
Changing the significance level after seeing the results
The significance level should be chosen before examining the test results. Changing it after seeing the p-value can make the decision less reliable. If several hypotheses are tested, the team should also consider the increased risk of false positives.
Treating the p-value as proof
A p-value below 0.05 does not prove that the alternative hypothesis is true. It indicates that the data provide sufficient evidence to reject the null hypothesis at the chosen level, assuming the test conditions are met.
Similarly, a p-value above 0.05 does not prove that there is no difference.
Ignoring the assumptions
Different tests have different requirements. Depending on the method, these may include independence, an appropriate distribution, or sufficient expected counts. Check the relevant assumptions before interpreting the result.
Confusing statistical and practical significance
A result can be statistically significant without being important in day-to-day work. A very small improvement may produce a low p value when the sample size is large, but the change may not justify its cost.
This is why teams should consider the effect size, confidence interval, process requirements, and business impact alongside statistical significance.
Confusing Statistical and Practical Significance
Suppose a company changes its order processing system. After the change, the average processing time falls from 10 minutes to 9.9 minutes.
A hypothesis test may show that the difference is statistically significant. However, a saving of six seconds per order may not be enough to justify the cost of the new system.
Now imagine the average time falls from 10 minutes to 7 minutes. That change may have a much greater effect on productivity, customer waiting times, and operating costs.
The p-value alone cannot tell you which improvement is more useful.
A confidence interval can help show the range of values that are reasonably consistent with the data under the method's assumptions. Looking at this interval alongside the estimated effect gives a clearer picture of the result.
The team should also consider how the change affects customers, employees, quality, and cost.
In short, hypothesis testing helps establish whether there is evidence of a difference. Practical knowledge helps determine whether that difference matters.
Hypothesis Testing in the Green Belt Exam
Hypothesis testing is an important topic for people preparing for a Six Sigma Green Belt certification. It connects statistical concepts with real process improvement problems.
During exam preparation, focus on understanding how the main concepts work rather than memorising definitions alone.
Start with the difference between the null hypothesis and the alternative hypothesis. You should be able to identify both statements in a short business or manufacturing scenario.
Next, practice interpreting p-values and significance levels. Remember that a p-value at or below the chosen significance level generally leads to rejecting the null hypothesis. A p-value above that level means you fail to reject it.
You should also understand Type I and Type II errors, test power, sample size, and the difference between one-tailed and two-tailed tests.
Test selection is another area worth practicing. Questions may ask you to identify whether a t-test, z-test, ANOVA, or chi-square test is suitable for a particular situation.
A good way to prepare is to work through practical questions and explain why one test fits better than another.
The Lean Six Sigma Green Belt certification can help professionals build their understanding of Six Sigma methods and tools. You can also use a Lean Six Sigma Green Belt practice test to check your knowledge and identify topics that need more revision.
For additional preparation, the ASQ: Six Sigma Green Belt certification page provides information about its certification program and related requirements.
The goal is to understand how statistical methods support decisions. Once you can connect a hypothesis, a test, and its result to a real problem, the topic becomes easier to remember and apply.
Conclusion
Hypothesis testing helps teams make decisions using data instead of relying only on assumptions. It provides a structured way to check whether a claim about a process, product, or population has enough statistical evidence to be rejected.
The process starts with the null hypothesis and the alternative hypothesis. The team then chooses a suitable test, sets a significance level, collects data, calculates the test statistic and p-value, and interprets the results.
Understanding p-values, Type I and Type II errors, sample size, test power, and confidence intervals makes it easier to use the method correctly.
In Six Sigma, hypothesis testing is particularly useful during the Analyze phase, when teams need to check possible causes of process problems. It can help them decide where to investigate further and avoid making changes without enough evidence.
The key is to look beyond the final p-value. A sound decision also depends on data quality, test assumptions, the size of the observed difference, and its practical impact.
When used carefully, hypothesis testing becomes a valuable tool for quality control, problem-solving, and continuous process improvement.










 Lowest-Price Challenge












 Personalized Path



.webp)


 USA
 Canada
 India
 UK
 Australia
 Singapore


