


 Call Us




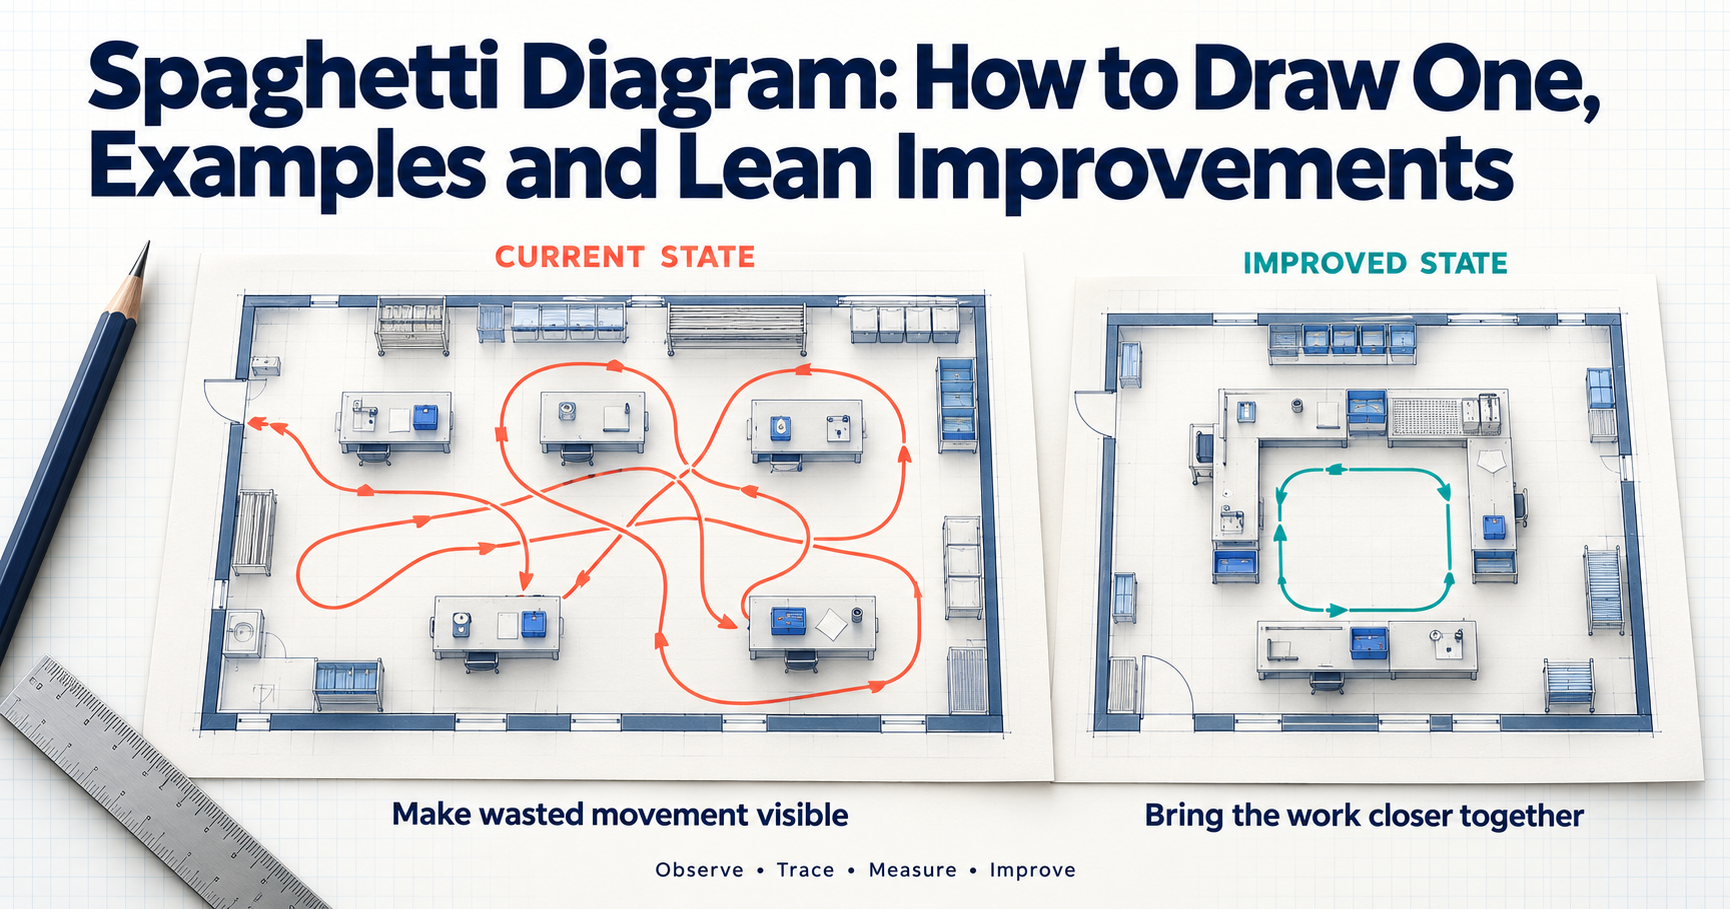
A spaghetti diagram is a simple Lean tool that traces the actual path a person, product, or document travels through a workspace. You sketch the layout, follow the work, and draw one continuous line for every move. The tangled result shows wasted motion and transportation at a glance, which gives teams a clear starting point for layout changes, shorter routes, and a smoother process flow.
Key Highlights of Spaghetti Diagram
- A spaghetti diagram, also called a spaghetti chart or spaghetti map, shows real physical movement drawn on a layout, not the ideal route on paper.
- It targets two of the seven wastes of Lean in particular: waste of motion and transportation waste.
- Drawing one takes four steps: sketch the layout, observe and trace movement, measure distance and time, and analyze the waste.
- It works anywhere people or materials move, from offices and hospital wards to warehouses and manufacturing floors.
- Before-and-after diagrams make results easy to see. In the sample cases in this guide, travel distance fell by 40% - 75%.
- In Lean Six Sigma projects, it is mainly a DMAIC Measure phase tool and is often paired with a time and motion study.
Introduction
Walk onto almost any shop floor, hospital ward, or office and watch one person for an hour. You will usually see the same pattern. They go to fetch something, come back, realise they need something else, and head out again. None of it feels wasteful at the moment. Added up across a shift, though, it can mean kilometres of walking and hours that the customer never pays for.
A spaghetti diagram makes that hidden movement visible. It is one of the simplest lean tools you can use: a layout, a pen, and patient observation. Yet it often produces the moment of clarity that a spreadsheet of cycle times cannot. When a team sees its own daily route drawn as a knotted mess of lines, the case for change almost makes itself.
If you are new to Lean, our guide on what is the lean process explains why Lean thinking treats any activity that does not add value as waste, or muda. The Lean Enterprise Institute: what is lean page is also a helpful primer on the customer-value mindset behind these tools.
In this guide, you will learn what a spaghetti diagram is, how it differs from a process map, and how to draw one step by step. You will see how teams in offices, hospitals, and warehouses use it, along with a before-and-after table with realistic figures, the tools available, and where the diagram fits in a Lean Six Sigma project. It is a practical starting point for any process improvement effort that involves people or materials moving around a workplace.
What Is a Spaghetti Diagram?
A spaghetti diagram is a visual record of the physical path that a person, material, document, or piece of equipment takes as work moves through a process. It is drawn on top of a floor plan or a rough layout sketch. Every time the subject moves, the observer extends a single unbroken line to show where they went. After a few cycles, the lines pile up and cross over each other, and the drawing starts to look like a plate of spaghetti. That is where the name comes from.
You will also hear it called a spaghetti chart, a spaghetti map, or a physical process flow diagram. The terms mean the same thing. For formal definitions, see ASQ: spaghetti diagram and the Lean Enterprise Institute: spaghetti chart entry in its Lean lexicon.
What makes the tool useful is its honesty. It does not show how the process is supposed to work. It shows what actually happened on a particular day: the extra trip to the printer, the walk back to the store because a part was missing, the detour around a pallet left in the aisle. That is why it sits comfortably among other Lean Six Sigma tools as a quick, low-cost way to collect facts before anyone proposes a fix.
Purpose in Lean
Lean thinking grew out of the Toyota Production System, and its core idea is to separate activities that add value for the customer from those that do not. For background on how this approach developed, see Lean manufacturing on Wikipedia. Walking and carrying rarely add value. A patient does not receive better care because a nurse walked to the supply room four times, and a customer does not pay more because a forklift crossed the warehouse twice.
A lean spaghetti diagram is built to expose two wastes in particular:
- Waste of motion: unnecessary movement by people, such as walking, reaching, bending, or searching for tools and information.
- Transportation waste: unnecessary movement of materials, products, or documents from one location to another.
Together with inventory, waiting, overproduction, overprocessing, and defects, these make up the seven wastes of lean, often remembered with the acronym TIMWOOD. Motion and transportation are often the hardest to notice because people get used to them. A long walk to the printer simply becomes "how things are done here." A spaghetti diagram puts a picture and a number on that habit.
The goal is not to measure walking for its own sake. Excess movement is usually a symptom of something deeper: a poor workplace layout, tools that are not stored at the point of use, batch handoffs, or an unclear process flow. In a lean manufacturing spaghetti diagram, for example, a long path between two machines often points to a layout optimization opportunity. Repeated trips to the tool crib usually point to a 5S or storage problem instead.
Spaghetti Diagram vs Process Map
Both tools describe a process, but they answer different questions. A process map shows the sequence of steps, decisions, and handoffs: what happens and in what order. A spaghetti diagram shows where the work physically travels and how far it goes. One is about logic. The other is about geography.
| Aspect | Spaghetti diagram | Process map |
| What it shows | Physical path of people or materials on a layout | Sequence of steps, decisions, and handoffs |
| Base drawing | Floor plan or layout sketch | Boxes, arrows, and decision symbols |
| Main question | Where does the work travel, and how far? | What happens, in what order, and who does it? |
| Waste it exposes best | Motion and transportation | Rework loops, delays, extra steps, unclear handoffs |
| Typical data | Distance, number of trips, walking time | Steps, decision points, time per step |
There are several forms of process mapping, including simple flowcharts, SIPOC diagrams, and the swimlane diagram, which splits steps into lanes by role or department. At a broader level, value stream mapping follows the flow of material and information across a whole value stream, from supplier to customer, and highlights lead time and waiting. A spaghetti diagram is far more local. It zooms into one area, such as a single ward, an office floor, or a picking zone.
In practice, the tools work best together. A team might use a process map to agree on the steps, then draw a spaghetti diagram to see how those steps play out on the floor. The process map might simply say "get approval." The spaghetti diagram shows that getting approval means two trips up a flight of stairs.
How to Draw a Spaghetti Diagram Step by Step
You do not need special training or software to draw a spaghetti diagram. You need a layout, a pen, a way to measure distance, and permission to watch the work. Before you start, decide three things: the process you will study (for example, admitting a patient or picking one customer order), the subject you will follow (a person, a product, or a document), and the time window (one cycle, one hour, or one full shift). Tell the people involved what you are doing and why. You are studying the process, not judging individuals.
Sketch the Layout
Start with a simple drawing of the area, roughly to scale. Mark walls, doors, workstations, machines, shelving, printers, supply cupboards, desks, and anything else people move between. An existing floor plan makes a good base, but check it on the floor first. Furniture and equipment rarely sit exactly where the drawing says.
Add a scale, such as one grid square equals one metre, and label or number each key location. Labels make the analysis much easier later, because you can say "the operator went from station 3 to the tool crib eight times" instead of describing arrows. Leave some white space around the edges for times and comments.
A useful habit is to walk the area yourself before observing anyone. This short gemba walk (gemba is the Japanese word for "the actual place" where work happens) helps you spot obstacles, one-way doors, shared corridors, and items your sketch has missed.
Observe and Trace Movement
Now follow your subject through the process. Each time they move, draw a continuous line from where they started to where they stopped. Do not lift the pen between moves, and do not straighten the line to make it look neat. If the person walked around a trolley, the line should go around the trolley too.
As you trace, number the trips or add small arrows to show direction. Write down why each move happened, even in two or three words: "fetch form," "printer jam," "find supervisor." These quick notes are often more valuable than the lines, because they explain the reasons behind the movement.
Observe several complete cycles, and if possible, at different times of day. A warehouse picker's route at 9 a.m. can look very different from the same route during the afternoon peak. If you are studying more than one role, use a separate sheet or a separate color for each person.
Measure Distance and Time
A picture is persuasive, but numbers make it useful. Once the route is traced, measure the length of each line using your layout's scale. On paper, a piece of string laid along the line and then measured against the scale works surprisingly well. Digital tools can calculate the distance for you.
Capture at least these measures:
- Total distance travelled per cycle or per shift
- Number of trips or stops
- Time spent walking or moving material
- Number of repeat visits to the same location
- Points where the subject waited or searched for something
Convert everything to a common basis, such as metres per order or kilometres per shift, so you can compare results later. These figures become your baseline.
Analyze Waste
With the diagram and data ready, review them as a team, ideally with the people who do the work. Ask a few direct questions:
- Where do the lines cluster? Dense clusters show the busiest paths and possible bottlenecks.
- Which trips go back and forth to the same place? Repeat trips often point to missing supplies, poor batching, or information that is not available at the workstation.
- Which locations are far apart but used one after the other? These are candidates for moving closer together.
- Where do lines cross? Crossing paths can create congestion and safety risks, especially where people and forklifts share space.
- Which moves add value from the customer's point of view? Usually very few.
Then classify each type of movement against the seven wastes. Most will fall under motion or transportation, but you will also find waiting (walking around looking for someone), defects (going back to fix an error), and overprocessing (taking a document to be signed twice). Rank the problems by distance or time lost and pick the biggest few to work on first. At this stage, you are finding opportunities, not redesigning the layout yet.
Spaghetti Diagram Example
The easiest way to understand the tool is to see it in use. The three cases below are composites based on common real-world situations, with realistic figures. Each spaghetti diagram example follows the same pattern: map the current route, measure it, find the waste, and change something simple.
Office Workflow Example
A finance team at a mid-sized company processes supplier invoices. Each invoice is received on paper, matched against a purchase order, approved by a manager, scanned, and filed.
An analyst sketched the office floor and followed one accounts payable executive through a batch of 20 invoices. The diagram showed nine separate stops: the mail tray at reception, the executive's desk, a shared printer at the far end of the floor, a filing cabinet in a side room, the manager's cabin on the floor above, and a scanner next to the pantry. The total walk came to about 380 metres per batch, and the cycle took 52 minutes.
The notes explained why. The printer and scanner sat in opposite corners. Purchase order copies were kept in a cabinet instead of online. The manager signed only on paper and was often away from the desk, so the executive climbed the stairs twice in one batch.
The team made three changes. They moved a multifunction printer-scanner next to the accounts payable desks, switched approvals to email sign-off, and set up a small, 5S-organised desk station with trays, stamps, and stationery. The repeat diagram showed four stops, about 95 metres of walking, and a 31-minute cycle. Nobody worked harder. They simply walked less.
Hospital Ward Example
Hospitals are one of the most common settings for spaghetti diagrams, because nurses walk a great deal and every minute away from the bedside matters. Studies of nursing workflow have repeatedly found that nurses can walk several kilometres in a single shift, much of it to fetch supplies, medicines, and equipment.
On a 28-bed medical ward, an improvement team followed one nurse through a full day shift. The spaghetti map covered the nurses' station, the medication room, the central supply room at the end of the corridor, the linen store, the patient bays, and the dirty utility room. By the end of the shift, the lines filled the corridor so thickly that the floor plan was barely visible. The measured total was about 6.8 kilometres, with 64 trips to the supply and medication rooms.
When the team reviewed the diagram with the nursing staff, the causes were clear. Everyday items such as dressings, gloves, saline flushes, and blood tubes were stocked only in the central store. Medication carts were restocked inconsistently, so nurses went back to the medication room mid-round. The linen store was at the opposite end of the ward from the busiest bays.
The team introduced small supply carts in each bay with a standard item list, a fixed restocking routine for medication carts, and a linen store closer to the high-turnover bays. The follow-up diagram showed about 4.1 kilometres walked and 29 supply trips per shift. The nurses estimated they gained roughly 40 minutes of extra time with patients.
Warehouse Picking Example
In most warehouses, order picking is the most labour-intensive activity, and travel takes up a large share of a picker's time. That makes picking routes an ideal subject for a spaghetti diagram.
A distribution centre for consumer goods asked a supervisor to trace one picker completing a wave of 20 orders. The aisle layout was drawn to scale with every pick location marked. The resulting path zig-zagged across the building. Fast-moving items were stored at the back, slow movers sat near dispatch, and the picker often doubled back down the same aisle because the pick list was printed in order-number sequence rather than location sequence. The route measured about 2.9 kilometres and took 48 minutes.
The team made three changes. They re-slotted the fastest-moving 20% of products into the aisles nearest the packing area. They switched to batch picking with a pick list sorted by location. And they introduced a one-way route through the aisles, which also reduced near misses with forklifts. The new diagram showed a much cleaner loop: about 1.6 kilometres and 29 minutes for the same wave of orders.
This is a classic layout optimization result. The picker's effort per item did not change, but the distance between pick locations did.
Spaghetti Diagram Before and After
The real power of the tool shows up when you draw it twice. A spaghetti diagram before and after comparison places the old route next to the new one, on the same layout and at the same scale. The "before" picture is usually a dense tangle. The "after" picture is a shorter, simpler set of lines with far fewer crossings.
That visual contrast matters more than many teams expect. Senior leaders who would skim past a table of cycle times will stop and study two diagrams side by side. Frontline staff, who often suspected the old layout was clumsy, get proof that their ideas made a difference.
The changes that most often shorten the lines include:
- Rearranging the workplace layout so that steps done one after another sit next to each other
- Storing tools, supplies, and forms at the point of use, often as part of a 5S in Six Sigma effort (sort, set in order, shine, standardise, sustain)
- Removing or combining steps that only exist to move work from one place to another
- Replacing paper handoffs with digital ones where it makes sense
- Changing batch sizes, pick sequences, or routes so people stop doubling back
- Converting a straight line of workstations into a U-shaped cell on the manufacturing floor
One caution: draw the "after" diagram only once the new method has settled, ideally a few weeks after the change. Otherwise, you may capture a best-behaviour version of the process that fades as soon as the project team steps away.
Sample Before and After Table
The table below summarises the three examples above, plus a spaghetti diagram manufacturing case from a machining cell. The figures are illustrative but realistic for these settings.
| Setting and process | Before | Main changes | After | Improvement |
| Office: invoice processing (per batch of 20 invoices) | 380 m walked, 9 stops, 52 min cycle | Printer-scanner moved next to AP desks, email approvals, 5S desk station | 95 m walked, 4 stops, 31 min cycle | 75% less distance, about 40% faster cycle |
| Hospital ward: day shift nursing (per nurse) | 6.8 km walked, 64 supply and medication trips | Bay-level supply carts, standard medication cart restocking, linen store moved closer | 4.1 km walked, 29 trips | 40% less distance, 55% fewer trips, about 40 min more patient time |
| Warehouse: order picking (per wave of 20 orders) | 2.9 km travelled, 48 min | Fast movers re-slotted near packing, location-sorted batch picking, one-way aisles | 1.6 km travelled, 29 min | 45% less travel, about 40% faster |
| Manufacturing: machining cell operator (per shift) | 1,150 m walked, 34 min of walking | U-shaped cell, shadow board for tools at the cell, inspection gauge moved into the cell | 420 m walked, 13 min of walking | 63% less distance, 21 min saved per shift |
The pattern is consistent across all four cases. Reducing movement does more than save steps. It shortens lead time, cuts interruptions, lowers fatigue and injury risk, and makes the process flow more predictable. In the warehouse, shorter routes meant the same team could handle the afternoon peak without overtime. On the ward, fewer trips meant fewer interruptions during medication rounds, which also supports patient safety. In the machining cell, the operator spent the saved time on setups, which raised output without adding staff.
Spaghetti Diagram Tools
There is no single best spaghetti diagram tool. The right choice depends on how often you draw them, who needs to see the result, and how accurate your distance figures need to be. Many experienced practitioners still start on paper and move the final version into software for reports.
Mobile Apps for Tracing
Tablets and phones have made tracing much easier, especially across large sites. Common options include:
- Drawing and note-taking apps on a tablet with a stylus. Import a photo or PDF of the floor plan and trace the route on top as you walk. Different pen colors and layers make it easy to separate people or cycles.
- Step counter and pedometer apps, carried by the person being observed with their consent, to cross-check the distance you measure on the drawing.
- Video recording of a work area, with permission, so the team can trace routes later and replay confusing moments.
- Indoor tracking and real-time location systems, used in some warehouses and hospitals, which record the movement of staff, carts, or equipment automatically and can produce movement heat maps.
Paper vs Digital Tools
Paper is still popular for good reasons. It is fast, cheap, and needs no batteries or log-ins. People on the floor also tend to feel more relaxed around a pen and clipboard than a tablet or camera.
Digital tools win when you need accuracy, sharing, and repeat comparisons. General diagramming software such as Microsoft Visio, Lucidchart, or draw.io lets you place a scaled floor plan and draw paths on separate layers. Spreadsheets like Excel can plot coordinates and total up distances. Some Lean Six Sigma software packages also include layout or spaghetti diagram templates, and CAD floor plans give precise measurements for larger facilities.
| Factor | Paper | Digital |
| Cost and setup | Almost none | Software licence or learning time |
| Speed on the floor | Very fast | Fast on a tablet, slower on a laptop |
| Distance accuracy | Approximate, measured by hand | Precise, often calculated automatically |
| Sharing and storage | Needs scanning or photos | Easy to share, edit, and compare versions |
| Best for | First observations, workshops, small areas | Reports, large sites, before-and-after comparisons |
A practical approach is to combine them: trace on paper at the gemba, then redraw a clean version digitally for your project report.
Tips for Better Spaghetti Diagrams
The method is simple, which is exactly why small mistakes can weaken it. Two habits make the biggest difference to the quality of what you capture.
Observe Real Work, Not the Standard
The most common mistake is drawing the route people are supposed to take instead of the one they actually take. Standard operating procedures, floor plans, and interviews all describe an ideal process. The value of a spaghetti diagram lies in catching the gap between that ideal and reality.
So go to the gemba and watch. Avoid asking someone to "show you" the process, because people naturally take the tidy route when they know they are demonstrating. Observe normal work over a normal period, including the messy parts: interruptions, missing items, a colleague asking for help, a printer that has run out of paper. Those are exactly the moments where waste hides.
Use Different Colors per Role
When more than one person or item moves through the same space, a one-color diagram quickly becomes unreadable. Give each role or subject its own color: blue for the nurse, red for the healthcare assistant, and green for the porter, for example. On a production floor, you might use one color for the operator and another for the material handler, or one for people and another for parts.
Color makes interactions visible. You can see where two roles cross paths, where one person waits on another, and which role carries most of the walking. Sometimes the best fix is not a layout change at all but a change in who does what, such as a dedicated runner who restocks supplies so nurses can stay in the bay.
Add a simple legend in one corner. If you trace several cycles for the same person, you can also use a different color per cycle to see how much the route varies. High variation is a finding in itself, because it usually means the process has no stable standard method.
Spaghetti Diagrams in the DMAIC Measure Phase
In Six Sigma projects, the DMAIC framework (Define, Measure, Analyze, Improve, Control) gives structure to improvement work. The six sigma spaghetti diagram belongs mainly in the DMAIC measure phase, where the aim is to understand the current state with facts and set a reliable baseline.
Here is how it supports the Measure phase:
- Baseline data: total distance, number of trips, and movement time become metrics you can track for the rest of the project.
- Current-state check: it confirms whether the process map drawn in Define matches what really happens on the floor.
- Focus for further measurement: it shows which steps or locations deserve closer timing or data collection.
- Shared understanding: it gives the sponsor and team one clear picture of the problem.
The diagram carries into later phases as well. In Analyze, the team uses it to dig into the root causes of excess movement. In Improve, it helps test new layouts on paper before anyone moves a desk or a rack. In Control, a repeat diagram confirms that the new route has been held. That is why a lean six sigma spaghetti diagram is often drawn three times in one project: current state, proposed state, and confirmed new state.
Professionals working towards a Lean Six Sigma Green Belt certification usually practise this tool alongside other Measure phase methods, such as data collection plans, check sheets, and basic process capability analysis.
Pairing With Time Studies
A spaghetti diagram tells you where people go and how far. A time study tells you how long each part of the work takes. Put the two together, and you get a much fuller picture of where time is lost.
In a classic time and motion study, the observer breaks a task into small elements and records the duration of each, separating value-adding work from walking, waiting, and searching. If you record times while you trace the route, you can answer questions such as:
- What share of the cycle time is movement rather than actual work?
- Which single trip costs the most time?
- How much time could a layout change realistically save?
In the warehouse example, the time study showed that walking made up well over half of the picker's cycle, while taking items off the shelves took a much smaller share. That one finding was enough to justify re-slotting the products.
Conclusion
A spaghetti diagram is one of the easiest lean tools to learn and one of the most revealing to use. With a floor plan, a pen, and an hour of honest observation, you can turn invisible movement into a picture that everyone understands. It brings waste of motion and transportation waste into plain sight, gives you baseline numbers for the Measure phase, and makes before-and-after results hard to argue with.
The examples in this guide, from an invoice desk to a hospital ward to a warehouse aisle, follow the same logic. Map what really happens, measure it, ask why, and bring the work closer together. The savings in a single cycle may look small, but a few hundred metres saved per batch or per shift adds up quickly over weeks and months.
If you want to apply tools like this within structured improvement projects, Simpliaxis Lean Six Sigma training covers the spaghetti diagram alongside process maps, data collection, and root cause analysis. You can also check your understanding of DMAIC concepts with the Lean Six Sigma Green Belt practice test.
The best way to start is small. Pick one process where people seem to walk too much, draw it this week, and see what the lines tell you.









 Lowest-Price Challenge













 Personalized Path



.webp)


 USA
 Canada
 India
 UK
 Australia
 Singapore


