


 Call Us




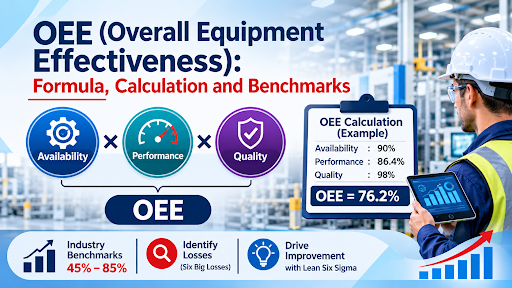
Overall Equipment Effectiveness (OEE) is a measure of how effectively a machine or a line is being used during actual planned production time. It's the product of three factors: Availability x Performance x Quality. 100% OEE would mean the equipment is only making good parts, at full speed, with no stop time. The average manufacturer is running at circa 60% OEE and 85% is considered world class.
Introduction
Walk around any factory floor, and the question that will be on everyone's lips is 'are our machines working as well as they could'? The honest answer is generally no. The machines break down. They're running below their rated speed. They're producing parts that are failing inspection.
For a very long time plant managers had no single figure to quantify all that loss. That all changed with the introduction of Total Productive Maintenance (TPM) in Japan where Seiichi Nakajima came up with a metric to rate the performance of equipment. That metric is Overall Equipment Effectiveness (OEE).
OEE is probably the most widely used manufacturing KPI in the world today. It's the language we all use to talk about downtime, speed losses and defects, and it directly tells you where the improvement work needs to be.
This guide explains what OEE is, how you define it, the OEE formula, Lean Six Sigma principles and how you go about doing an OEE calculation step by step. It also covers benchmarks, the six big losses,Six Sigma metrics, and common mistakes. By the end of it, you'll be able to measure and improve the efficiency of your own lines.
What Is OEE?
Let's define OEE in plain terms. OEE is Overall Equipment Effectiveness and it's just the ratio of actually productive time to planned production time.
In other words OEE answers one question: of the time that you scheduled the machine to run, what percentage of that time actually produced good parts at full speed? The answer is a percentage.
A score of 100% would represent perfect production. The machine would be making only good parts at the maximum possible rate with zero stop time. That's rarely going to happen in the real world. Even the very best plants are going to have some loss.
OEE was developed as a core metric within Total Productive Maintenance (TPM), which is a system that treats the operator and the maintenance people as partners in the health of the equipment. TheLean Enterprise Institute defines TPM as a methodology for maximising equipment effectiveness over the life of the asset. OEE is the scoreboard for that.
OEE vs Efficiency vs Utilization
A lot of teams completely muddle the three related concepts of OEE, machine utilisation and production efficiency and think they're all the same. They're not. They're measuring different things.
Machine utilisation is a measure of how much of the available calendar time the machine is actually running. A machine which is running 24 hours a day would be at 100% utilisation irrespective of whether it's making scrap the whole time. Utilisation tells you nothing about output quality or speed.
Production efficiency is generally defined as actual output against a standard output rate. It's a measure of speed rather than a measure of quality and doesn't take into account downtime or defects.
OEE is the most stringent of the three. It's availability x speed x quality all combined into a single figure. The only time that counts is the time that the machine is actually producing good parts at the ideal speed. A line can be running at a very high level of utilisation and still have a horrific OEE.
The OEE Formula
TheOEE formula looks simple, but each part carries real meaning:
OEE = Availability x Performance x Quality
Each factor is a percentage. You multiply them together to get the final score. The three factors are multiplied, not added. That's why poor performance in one area will have a detrimental effect on the overall result.
Availability
Availability measures whether the machine was actually running during planned time. The formula:
Availability = Run Time / Planned Production Time
Run time is planned production time with less downtime. Downtime is all the time lost to breakdowns, changeover, material shortages and any other stoppages. If you have 480 minutes of planned production and 60 minutes of downtime then your availability is 420/480 which is 87.5%.
Two maintenance metrics go directly into the availability calculation. MTBF (Mean Time Between Failures) is the average time between failures. MTTR (Mean Time To Repair) is the average time it takes to repair a failure. Both of those are improved by increasing MTBF and reducing MTTR.
Performance
Performance measures how fast the machine ran when it was running. The formula:
Performance = (Ideal Cycle Time x Total Count) / Run Time
Ideal cycle time is the rate at which the machine can produce one part. Total count is everything it's made (good and bad). If a machine is capable of making one part per minute and in 420 minutes of run time actually makes 400 parts, its performance is 400/420 i.e. about 95%.
Performance losses arise in two ways: the small stops which the operator clears in seconds and running at a speed below rating. These losses are very difficult to detect as the machine never actually comes to a complete stop.
Quality
Quality measures how many good parts came out of the machine. The formula:
Quality = Good Count / Total Count
A good count is the number of parts that pass inspection on the first go. Scrap and rework both count against you. If a machine makes 350 parts and 343 of them are good, then the quality is 343/350 which is 98%.
Calculating OEE Step by Step
Calculating OEE requires just three pieces of data: planned production time, total count at ideal cycle time and good count. Do it like this.
Step 1: Fix the planned production time. Take the scheduled shift length and subtract planned stops (i.e. planned breaks and planned maintenance).
Step 2: Record all downtime. Any stoppage during the planned time counts. Take the planned production time and subtract the downtime to give you the run time.
Step 3: Count total output. Log every bit of output the machine generated, whether good or bad.
Step 4: Count the good bits. Go through the output and note how many of them passed on the first pass.
Step 5: work out the availability, performance and quality using the above formulae.
Step 6: Multiply the three factors together. That gives you your OEE score.
There is also a shortcut formula that gives the same answer:
OEE = (Good Count x Ideal Cycle Time) / Planned Production Time
This works as it collapses all three factors into a single expression. Both methods should give the same result. If they don't then check your inputs.
Data collection quality is everything. The manual method uses operator log sheets and end of shift counts. It's very low cost but misses the micro stops and is entirely dependent on the operator being honest and consistent.
The automated method pulls the signals directly from the machine controller or from add-on sensors. It will capture every single stop and every single cycle including the two second hiccups that the operator simply stops noticing. Most plants will start with the manual method to establish a baseline and then go on to automate the bottleneck machines first.
One rule above all: define your terms once and keep them fixed. If your planned production time, your ideal cycle time or your good count are changing from week to week then your trend line is absolutely worthless. Consistency wins every time over sophistication.
Worked OEE Calculation Example
Here's a full example from a single 8 hour shift.
The shift is 480 minutes long. Planned stops for breaks and a shift meeting add up to 30 minutes. That leaves 450 minutes of planned production time.
During the shift the machine lost 45 minutes to a jammed feeder and a short power dip. Run time was 450 minus 45 i.e. 405 minutes.
Availability = 405 / 450 = 90.0%
The machine has an ideal cycle time of 0.5 minutes per part. It produced 700 total parts in 405 minutes of run time. At ideal speed it would take 350 minutes to produce 700 parts.
Performance = 350 / 405 = 86.4%
Of the 700 parts, 686 passed on the first go.
Quality = 686 / 700 = 98.0%
Now multiply the three factors:
OEE = 0.900 x 0.864 x 0.980 = 76.2%
This shift ran at 76.2% Overall Equipment Effectiveness. The number alone is not the story. The breakdown of factors is. Availability and performance are the weak links, so improvement efforts should target stop time and speed losses first.
OEE Benchmarks in Manufacturing
Statistics show that the average OEE for an organization ranges from 35% to 65%. OEE scores for discrete part and product manufacturing typically ranges from 55% to 65%. Scores below 55% are more common. OEE.com states that less organizations achieve OEE scores above 85% when compared to the number of organizations that achieve scores below 45%
When establishing targets, these averages may serve as guides. Treat the averages as guides to assess your potential, and not as targets to strive for. When using averages as guides, consider unique characteristics of your organization and your competition.
For example, a production line that produces a wide variety of products using complex processes and tools, has frequent change-over and set up, and produces a lower annual volume compared to a production line that produces the same product each year, cannot be fairly compared using averages.
| Industry | Typical OEE Range |
| Discrete manufacturing (average plant) | 45% to 65% |
| Automotive and tier-one suppliers | 65% to 85% |
| Food and beverage filling and packaging | 50% to 75% |
| High-volume consumer packaged goods | 65% to 85% |
| World-class performers | 85% and above |
The Lean Enterprise Institute indicates that when OEE is multiplied it is dominated by the lowest factor. Therefore, a production line should be assessed in relation to its historical performance and adjusted practices and processes.
The most fair production line comparison should be to itself. A production line should be assessed using a combination of historical, current and predicted future performance.
Establishing a baseline is the first and the most important step towards achieving improved production line performance. A baseline is established by collecting data for a two to four week time period. Improving OEE by 5 to 10 points in a given time period is a fair and achievable goal.
If you are looking for the right course in Lean Sigma, enroll in the Lean Six Sigma Green Belt certification by Simpliaxis.
World Class OEE
It is generally accepted that an OEE score of 85% or greater is considered world class. Nakajima’s TPM breaks down availability, performance and quality as 90%, 95% and 99.5% respectively. OEE.com suggests that to achieve world class status and win the Distinguished Plant Prize, a plant’s TPM implementation must integrate a score of 85% or greater.
There are two things to consider with that number. First, it is from Japanese automotive plants of the 1970s, and may not apply to your situation. Second, continuously aiming for an 85% productivity goal can, over time, demotivate a workforce that has previously achieved a 40% goal. Productivity improvement should be addressed in a series of incremental steps. After a reasonable improvement period (3 to 4 months) raise the productivity goal.
The Six Big Losses and OEE
The significance of the various productivity losses sustained by a given piece of equipment can be assessed through the framework of OEE. It is for this reason that TPM, and related programs and initiatives, are focused on reducing the big losses.
The Big Losses are:
1. Losses attributable to equipment failure and breakdowns
2. Losses attributable to setups and changeovers
3. Losses attributable to idling and minor stops
4. Losses attributable to operating equipment at a reduced speed
5. Losses attributable to equipment start-ups
6. Losses attributable to defective or nonconforming product
Mapping Losses to OEE Factors
As stated above, each of the big losses impacts a specific factor of OEE. Understanding this provides the basis for developing corrective strategies.
Performance Losses
Minor stops and operating at speeds less than the rated speed negatively impact the performance factor. Losses from minor stops and operating at sub-rated speeds are frequently overlooked.
Machines that take a short break to recover during each cycle typically do not appear in downtime reports, but can significantly impact process throughput over a given period of time. Operating at sub-rated speeds to maintain a margin of safety is commonplace, and while it is not as significant as a minor stop, it should be accounted for.
Quality Losses
Much like defects, minor stops and sub-rated speeds may occur during the starting or running of a process and result in scrap or rejects.
During a changeover, there may be a period of time in which the process is not stable, and bad parts may be produced. Parts produced during normal operation of a process that do not meet specifications are considered scrap and should be accounted for. Minor stops that occur during changeovers or production should be recorded.
Pareto Analysis
Identifying the root cause of the largest loss contributing to low OEE should be the next step after evaluating the types of losses that occur. Focusing on largest loss utilizing thePareto principle aligns with thelean philosophyof prioritizing the largest or most significant waste.
How to Improve OEE?
After the largest loss has been identified, many strategies are available for implementation to quickly improve OEE. Additional strategies have been provided and organized by each factor.
Reducing Losses
Downtime is loss. A stop event log should be created to capture the who, what, when, how long, and why of each and every stop.
A wide variety of loss causing events should be documented including equipment breakdowns, process failures, setups and adjustments. Prior to and after a preventive maintenance activity, logs should be created to capture the reason for the activity and duration.
Other activities that may increase equipment uptime and reliability and reduce loss should be implemented including improvements to housekeeping and adequacy of lubrication.
During a changeover, SMED should be implemented to reduce loss and increase equipment uptime. Setup and adjustment losses should be accounted for, and loss producing activities should be eliminated.
Many plants usecontrol chartsto identify when processes start to drift outside normal limits. Being proactive about minor defects allows plant staff to continuously improve the process and eliminate larger defects.
Reduce Speed Losses
Go/No-Go gauges or other cycle time indicators can help identify process speed losses. If losses occur, and performance is consistently above 100%, then your standard is incorrect and process speed losses may be greater than expected.
Look for and address causes of hundreds of micro-stops that occur during a shift. Remind operators of the importance of running at or above the minimum process speed to reduce losses.
Increasing process speed by addressing losses can also be thought of as improving quality.
Improve Defects
Several quality tools can help identify theroot cause of defects. Inconsistent incoming material can cause process drifts and therefore defects. Focused factory tours can help identify root causes.
Standard work can also help reduce variation and improve stability of processes. The first several parts produced during a process change or adjustment should be inspected to determine process control and whether stability has been achieved
Don't disregard the importance of culture. Your staff is more likely to identify and correct causes of poor quality if they have a basic understanding of the tools and concepts ofquality management.
The loss element of OEE is the most powerful tool for identifying opportunities for loss reduction.
First Pass Yield and other similar quality tools are used in conjunction with OEE to improve quality.
Teams, in an effort to further understand loss elements, have integrated OEE concepts with value stream mapping.
Value Stream Mapping, when used with OEE, helps identify loss elements and pinch points in the process.
Several limitations have been identified with the use of the OEE metric. These need to be examined to understand and improve its effectiveness.
OEE Metric Pitfalls
1. Gaming the Metric
OEE can be intentionally and falsely reported at high levels. This is known as gaming the metric. Management often sets artificial targets for loss reduction. If targets are not met, employees can reclassify planned losses as unplanned to achieve a falsely reported high level of OEE. Ideal cycle times can be intentionally increased. Likewise, employees can report a low level of defects by arbitrarily determining which defects are good.
There are methods to validate process controls and efficiencies. These include verifying ideal cycle times by examining actual machine throughput times, reviewing planned vs. unplanned loss classification, and reviewing definition of good parts. OEE should not be used to set improvement goals. A plant that improves its OEE to 70% is better than a plant reporting 80% OEE and taking no improvement actions.
2. Comparing Unrelated Things
A second error is comparing unlike pieces of equipment. An OEE score is really only useful when discussing equipment of the same type. A high-mix machine that changes over 20 times a week can’t be compared to equipment that runs a single product. Similarly, equipment constraints of 10-year-old machines can be very different from constraints of equipment purchased that year.
Old equipment can’t reasonably be expected to perform like new equipment. It’s better to compare equipment to itself. High performing equipment can be compared to other equipment. Plant averages can be used to roughly compare plants.
OEE and Lean Six Sigma
The integration of OEE with the tools of Lean Six Sigma is a natural fit. This is particularly true during theMeasure phase, where hard data limits can be placed on loss, and during the Analyze phase, where loss structures can be developed from the Six Sigma tools.
After defining the problem as low OEE on a bottleneck machine, a team can measure each of the three components of OEE. The loss can be further analyzed and broken down into minor components. Once lost, and if correctable, OEE can be significantly improved.
OEE integrates with lean methodologies. With knowledge of lean concepts, misconceptions about OEE tend to disappear. The focus on customer value can also be traced to OEE. To understand Lean methodologies, a basic understanding of Six Sigma is vital. This is particularly important when defining the projects associated with OEE.
Fluency with OEE has become vital for career advancement, especially for industrial engineers. Strong growth is projected in this field. Industrial engineers who are proficient in evaluating equipment effectiveness and improving equipment effectiveness are highly valued. Obtaining aGreen Belt in Lean Six Sigma is a great added advantage for industrial engineers. This can be combined with other projects focusing on improving OEE.
Conclusion
Most manufacturers understand that OEE is a way to measure overall productivity. A simple formula is used to measure overall equipment effectiveness. The formula, however, does not address why productivity is substandard. It provides no context as to the reasons for the substandard productivity. Bleeding capacity is a bigger concern than overall productivity. It is important to understand the components of the equation.
To be competitive, a plant's performance should exceed industry averages. Equipment losses should be continuously measured, addressed and remeasurement should be routine. The focus should be on improving equipment effectiveness. Long-term improvement should be the goal. Daily and weekly performance reports and analysis should assess if trends are improving.
If you want to enhance your career and learn how to enhance the production processes of your organization, you should enrol in Simpliaxis’s training program with the Lean Six Sigma Green Belt practice test.










 Lowest-Price Challenge













 Personalized Path






 USA
 Canada
 India
 UK
 Australia
 Singapore


