


 Call Us



How can you tell whether work is flowing smoothly or simply keeping everyone busy?
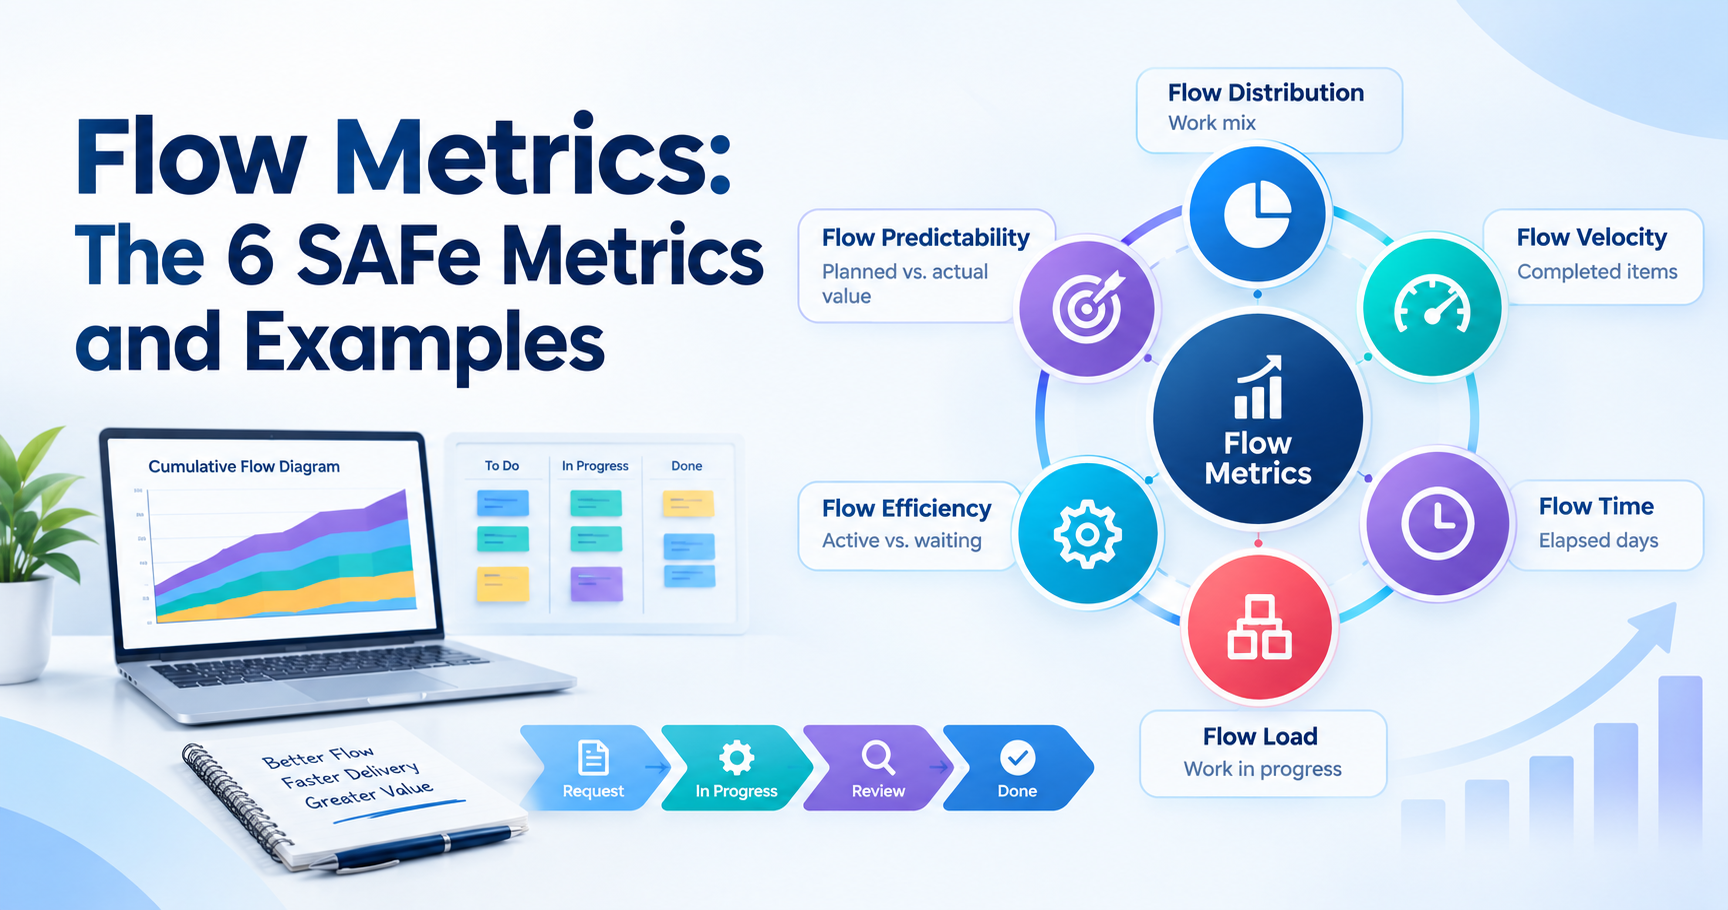
Flow metrics measure how work moves through a value stream, not how busy people are.SAFedefines six flow metrics: flow distribution, flow velocity, flow time, flow load, flow efficiency, and flow predictability. Together they show what work gets done, how much finishes, how long it takes, how much is in progress, how much time is lost to waiting, and how reliably plans are met. Little's Law connects flow time, flow load, and flow velocity.
Key Highlights of Flow Metrics
- The six flow metrics are distribution, velocity, time, load, efficiency, and predictability.
- The six metrics track completed work, elapsed time, work in progress, work mix, active time, and delivery predictability. Together, they reveal where work gets delayed and where the delivery system can improve.
- Flow time equals flow load divided by flow velocity (Little's Law).
- Most items spend far more time waiting than being worked on.
- Board timestamps provide much of the data needed to calculate flow time, flow load, and flow efficiency. Flow distribution also requires work-item classification, while flow predictability requires planned and actual business-value data.
- Use the data to fix the system, never to rank people or teams.
Introduction
A team reports a steady 40 story points per sprint. Yet a feature requested in March reaches customers in August, and nobody can say where the five months went.
Flow metrics answer that question. They track how long work takes, how much of that time is spent waiting, and how much work is stuck in progress at once.
This guide explains the six SAFe measures, the math that links them, how to collect the data, and how to act on it. You will also find flow metrics examples with realistic numbers, team and Agile Release Train (ART) guidance, and the Scrum Master's role.
What Are Flow Metrics?
Flow metrics are measurements of how work items travel from request to delivery through a value stream. They cover speed, volume, waiting, workload, work mix, and reliability. Because they track actual work items, workflow states, and elapsed time, flow metrics show how work moves through the delivery system. Unlike estimates alone, they help teams identify delays, work in progress, and delivery patterns.
Definition and the Idea of Flow
SAFe defines flow as the smooth, fast movement of work product from step to step in a value stream. Healthy flow means work rarely waits. Poor flow means work queues at every handoff.
Every measure in this flow metrics framework counts a unit called a flow item. Flow metrics build on concepts from Mik Kersten's Flow Framework, while SAFe uses six metrics to assess how work moves through a value stream. The Flow Framework groups work into four categories: features, defects, risks, and debt. SAFe teams may use work-item categories such as features, stories, defects, and enablers, depending on the level and context. Define the categories used in your workflow before measuring flow distribution.
Why Flow Metrics Beat Output-Only Measures
Picture two teams, each finishing 40 points a sprint. One ships features in a week, while the other holds them in review for a month. Output metrics rate them equally. Flow metrics show the difference immediately.
Flow metrics rely on observable data, such as completed items, workflow timestamps, and work in progress. This makes them less dependent on subjective estimates than story-point velocity alone. However, teams can still distort flow metrics by changing item definitions or workflow rules, so consistent measurement is essential.
Flow Metrics vs Traditional Agile Metrics
Flow metrics in agile complement what you already track. Thetop 10 agile metricsinclude velocity and burndown, which describe sprint output. Flow measures describe an item's entire journey.
Question | Traditional metric | Flow metric |
| How much did we finish? | Story points per sprint | Flow velocity (items) |
| How long did it take? | Sprints elapsed | Flow time (calendar days) |
| How much is in progress? | Sprint commitment | Flow load |
| Where do we wait? | Rarely visible | Flow efficiency |
| How closely did we meet the plan? | Sprint goal achievement | Flow predictability (planned vs. actual business value) |
| What are we working on? | Rarely tracked | Flow distribution |
Two neighbors deserve a mention. Kanban metrics such as lead time, cycle time, and WIP supply the raw ingredients, and SAFe adds business context. DORA metrics, in contrast, focus on software delivery performance, such as deployment frequency, while flow measures cover the whole value stream, including upstream waiting.
The Six SAFe Flow Metrics
SAFe flow metrics each answer one question, and they work best as a set. This overview shows how each is expressed.

Flow Distribution
Distribution reveals whether the actual work split matches strategy. It shows whether the real mix of items matches the allocation the business intended.
A healthy mix depends on context. A new product leans toward features, while a mature one may need more technical debt work. Watch whether defects are consuming more capacity than expected. A growing defect share may indicate quality problems, but check the work-item counts and the overall mix before deciding what action to take.
Flow Velocity
Flow velocity counts items finished in a given period. When measuring throughput, agile teams count completed work items rather than story points, making the measure less dependent on changing estimation habits.
Its trend is more useful than a single reading. Rising flow velocity with stable or falling flow load may indicate improved delivery, but check flow time, quality, and customer outcomes before concluding. If velocity and defects both rise, investigate whether the change reflects a quality issue, a different work mix, or another factor.
Flow Time
Flow time covers the elapsed days from entering the value stream to reaching the customer. It includes active and waiting states, including weekends and off-hours. Customers experience this number directly.
Report a median and a high percentile, such as the 85th. Averages hide the long outliers that frustrate stakeholders most.
Flow Load
Flow load is the count of items in progress, whether they are actively being worked on or waiting. Tracking it alongside flow time can help teams spot potential overload. If work in progress grows while throughput remains similar, items may take longer to complete. Because load can be read from today's board, it is the easiest metric to act on.
Flow Efficiency
Flow efficiency divides active days by total days, so it shows how much of an item's life is spent being worked on.Value stream mapping is a practical way to find where that waiting happens. For a full breakdown, see the guide toflow efficiency.
Expect low numbers. Flow efficiency can be low when items spend much of their time waiting for reviews, approvals, dependencies, or testing. A low score does not automatically mean people are working slowly. It often indicates that items spend substantial time waiting for reviews, approvals, dependencies, or testing. Examine the workflow to identify the main delays, then track whether targeted changes reduce waiting time.
Flow Predictability
Flow predictability compares the business value planned for a Program Increment (PI) with the value actually delivered. At the ART level, teams use this measure to assess how closely actual outcomes match their PI objectives. Follow the calculation method and guidance used by your organization. Consistently high predictability is useful, but it should also be considered alongside the ambition and business value of the objectives.
A score consistently at 100% can signal sandbagging, meaning objectives that are too easy. The goal is reliable and ambitious, not just reliable.
How Flow Metrics Connect Through Little's Law?
Little's Law is a queueing theory result that explains why the six measures move together. It also makes flow metrics calculation a matter of simple division.
Flow Time = Flow Load ÷ Flow Velocity
Little’s Law states that average time in a system equals average work in progress divided by average throughput. In SAFe terminology, this relationship can be expressed as flow time = flow load ÷ flow velocity. Use consistent units and the same workflow boundaries for all three measures. The relationship is most useful when the system is reasonably stable over the measurement period.
For example, a team with 30 items in progress that finishes 10 per week has an average flow time of three weeks. The law applies to stable systems and long-run averages. Do not use it on a single unusual week.
Why Reducing Flow Load Speeds Delivery
If throughput holds steady, fewer items in progress means shorter flow time. Cut that same team's load to 20, and the average falls to two weeks.
The mechanism is practical. Too much work in progress increases context switching and waiting. People juggle tasks, and every task slows down.
One caution: the law does not say zero work is ideal. If load drops so far that people sit idle, throughput falls too. Find the level where velocity stays high and flow time stays low.

How to Measure Flow Metrics
Learning how to measure flow metrics starts with data you likely have already. Flow metrics measurement uses state-change timestamps, the same data behind kanban metrics, so a team with a working Kanban boardis halfway there.
Using a Cumulative Flow Diagram
If you are asking what is cumulative flow diagram in SAFe terms is, it is a stacked area chart showing how many items sit in each workflow state over time. It displays three signals at once:
- Widening band: More items are accumulating in a workflow state, which may indicate a bottleneck.
- Vertical distance between relevant bands: Shows the number of items in those states at a given point in time.
- Horizontal distance between relevant points: Can help estimate how long work spends in a state or across a workflow, depending on the chart and the points being compared.
Instrumenting Your Board or ALM Tool
Follow these steps:
- Define start and finish. Agree on the workflow states that mark the beginning and end of flow time. For example, a team might start measurement when work is committed and stop when the item meets its agreed completion or delivery criteria. Apply the same boundaries consistently when comparing results.
- Classify each state as active or waiting. This enables the efficiency calculation.
- Tag item types. Classify work items using the categories agreed for your workflow, such as features, defects, risks, technical debt, stories, or enablers, as appropriate to the level being measured. Keep the definitions consistent over time.
- Pull timestamps automatically. Jira, Azure DevOps, and similar tools record every transition.
- Build one dashboard. Avoid manual spreadsheets, which decay quickly.
A simple state map shows how step two works:
Workflow state | Classification |
| Ready | Waiting |
| In development | Active |
| Awaiting review | Waiting |
| In testing | Active |
| Awaiting release | Waiting |
Setting Baselines and Targets
Collect eight to twelve weeks of history before setting any goal. Then aim at a trend, such as a steadily falling 85th percentile of flow time, instead of an arbitrary number. Revisit the baseline each quarter, because the system keeps changing.
Flow Metrics Example (Worked)
Here is a hypothetical example. A team of eight tracks all six measures for a quarter. It then limits work in progress for two months and measures again.
Metric | Baseline | After two months |
| Flow distribution (features/defects/risks/debt) | 55 / 25 / 5 / 15 % | 60 / 18 / 5 / 17 % |
| Flow velocity (items per week) | 6 | 6.5 |
| Flow load (items in progress) | 18 | 12 |
| Flow time (average days) | 21 | 13 |
| Flow efficiency | 19% | 32% |
| Flow predictability | 81% | 88% |
Checking the numbers. At baseline, 18 items in progress divided by a throughput of 6 items per week gives an average flow time of 3 weeks, or 21 days. After the change, 12 items divided by 6.5 items per week gives approximately 1.85 weeks, or 13 days. For this hypothetical example, assume an average active time of 4 days per item at baseline and 4.2 days afterward. That gives flow-efficiency estimates of about 19% (4 ÷ 21) and 32% (4.2 ÷ 13), respectively. In a real workflow, calculate efficiency from recorded active time and total flow time using consistent definitions.
What changed. The team introduced a work-in-progress limit. After two months, flow load fell from 18 to 12 items, average flow time dropped from 21 to 13 days, and flow efficiency increased from 19% to 32%. Flow velocity and predictability also improved. These results are consistent with better flow, although the team should review the underlying work-item data and other changes before attributing every improvement to the WIP limit. The lower defect share also needs to be interpreted alongside the total number and type of completed items.
Reading a Team's Flow Metrics Dashboard
A useful flow metrics dashboard shows trends, not single readings. Read it in this order:
- Distribution: is the work mix what the business wants?
- Load and time together: rising load with rising time signals overload.
- Efficiency: low values point to queues, not slow people.
- Velocity: Stable flow velocity alongside falling flow time may indicate smoother delivery. Check quality, work-item size, and customer outcomes to confirm that the improvement is meaningful.
- Predictability: It tells you how far to trust the plan.
Using Flow Metrics to Improve
Measuring is only half the job. Match the pattern you see to a likely cause, then run a small experiment.
What you see | Likely cause | First experiment |
| Load and flow time both rising | Overload | Set a WIP limit |
| Low efficiency, normal load | Queues and handoffs | Find the longest-waiting state |
| Defect share growing | Quality debt | Invest in test automation |
| Low predictability, stable flow time | Planning or dependency issues | ImprovePI planning and dependency handling |
Spotting Bottlenecks and Queues
Look for workflow states where the number of items is increasing, or items remain for long periods. A widening band on a cumulative flow diagram may indicate that work is accumulating in that state. Low flow efficiency can also signal substantial waiting time. Investigate the underlying workflow data to identify the bottleneck before deciding how to address it.
Common culprits include review queues, shared test environments, and approval steps. Fix the constraint, then measure again, because bottlenecks tend to move downstream.
Reducing WIP to Cut Flow Time
Set an initial work-in-progress limit based on your current load, workflow constraints, and team capacity. Trial it for two or three weeks, then compare flow time, throughput, and waiting patterns with the baseline. Little’s Law helps explain the relationship between work in progress, throughput, and flow time, but the actual result depends on how the system responds. Pair the limit with appropriately sized items to support smaller batches and earlier feedback.
Rebalancing Flow Distribution Toward Value
Decide your intended allocation first, then compare it with reality. The share of effort on defects, debt, and risk, compared with new features, shows where capacity actually goes. Shift the mix gradually, and explain the reasoning to stakeholders so the change feels deliberate.
Flow Metrics at Team and ART Level
The same six measures apply at several levels. Flow metrics in SAFe serve teams, Agile Release Trains, and the portfolio, but the audience and the item size change.
Team Flow vs Agile Release Train Flow
At team level, items are usually stories and defects, and the team uses the data in retrospectives. At ART level, items are features and capabilities, so flow time includes dependencies between teams.
Predictability belongs mainly at ART level, since it compares PI objectives with outcomes. Leaders use SAFe flow metrics at this level to find systemic delays, such as slow architectural decisions.
Leaders andRelease Train Engineers use SAFe flow metrics at this level to find systemic delays, such as slow architectural decisions.
Rolling Up Metrics Across Teams
Never add story points across teams, because each team's points mean something different. Combine item counts by type instead, and report medians and percentiles for flow time. Agree first on what counts as started, finished, and waiting. Without shared definitions, a roll-up is noise.
Common Mistakes to Avoid
Weaponizing Metrics Against Teams
When leaders rank teams by flow numbers, people game them. They split items artificially or skip quality steps. Show the data to teams first, and present it as a way to remove obstacles.
Watching One Metric in Isolation
Any single measure can mislead. Pushing velocity up can raise load and defects. Cutting flow time by finishing only small items hides the large, important ones. Read the set together, and add customer outcomes alongside it.
The Scrum Master's Role With Flow Metrics
A Scrum Master turns numbers into conversations. They do not own the data, but they help the team use it.
- Retrospective: show the cumulative flow diagram, and ask where work waited.
- Sprint planning: use typical flow time to help the team commit to realistic scope.
- Daily Scrum: point to the items that have been in progress longest.
- Stakeholder updates: explain trends, and resist targets on single numbers.
Scrum Masters who want structured practice can explore SAFe Scrum Master Certification Training, which covers flow, WIP limits, and continuous improvement across a Release Train.
Best Practices for Flow Metrics
- Begin with three: Start with load, time, and velocity, then add the rest once the data is trusted.
- Write down definitions: Record what counts as started, finished, and waiting, perhaps in your team working agreements.
- Keep one page: A single dashboard gets read, while five dashboards get ignored.
- Annotate events: Mark releases, reorganizations, and policy changes on the charts so trends make sense later.
- Automate flow metrics measurement: Pull data from your tool, so nobody maintains a spreadsheet.
- Pair with outcomes: Show customer and business results next to the flow data.
- Share with the team first: People trust metrics they saw before their managers did.
Conclusion
Flow metrics replace guesses about speed with facts about how work moves. The six SAFe measures give a complete picture of what you work on, how much finishes, how long it takes, how much is in progress, where time is lost, and how reliably you meet plans.
Little's Law explains the pattern. If delivery is slow, limit work in progress first, then remove the queues that cause waiting.
Pick one team, gather eight weeks of data, and build a simple dashboard. Then change one thing and measure again. Small repeated experiments will teach you more than any target.








 Lowest-Price Challenge











 Personalized Path


.webp)


 USA
USA  Canada
 India
India UK
UK Australia
 Singapore


