


 Call Us




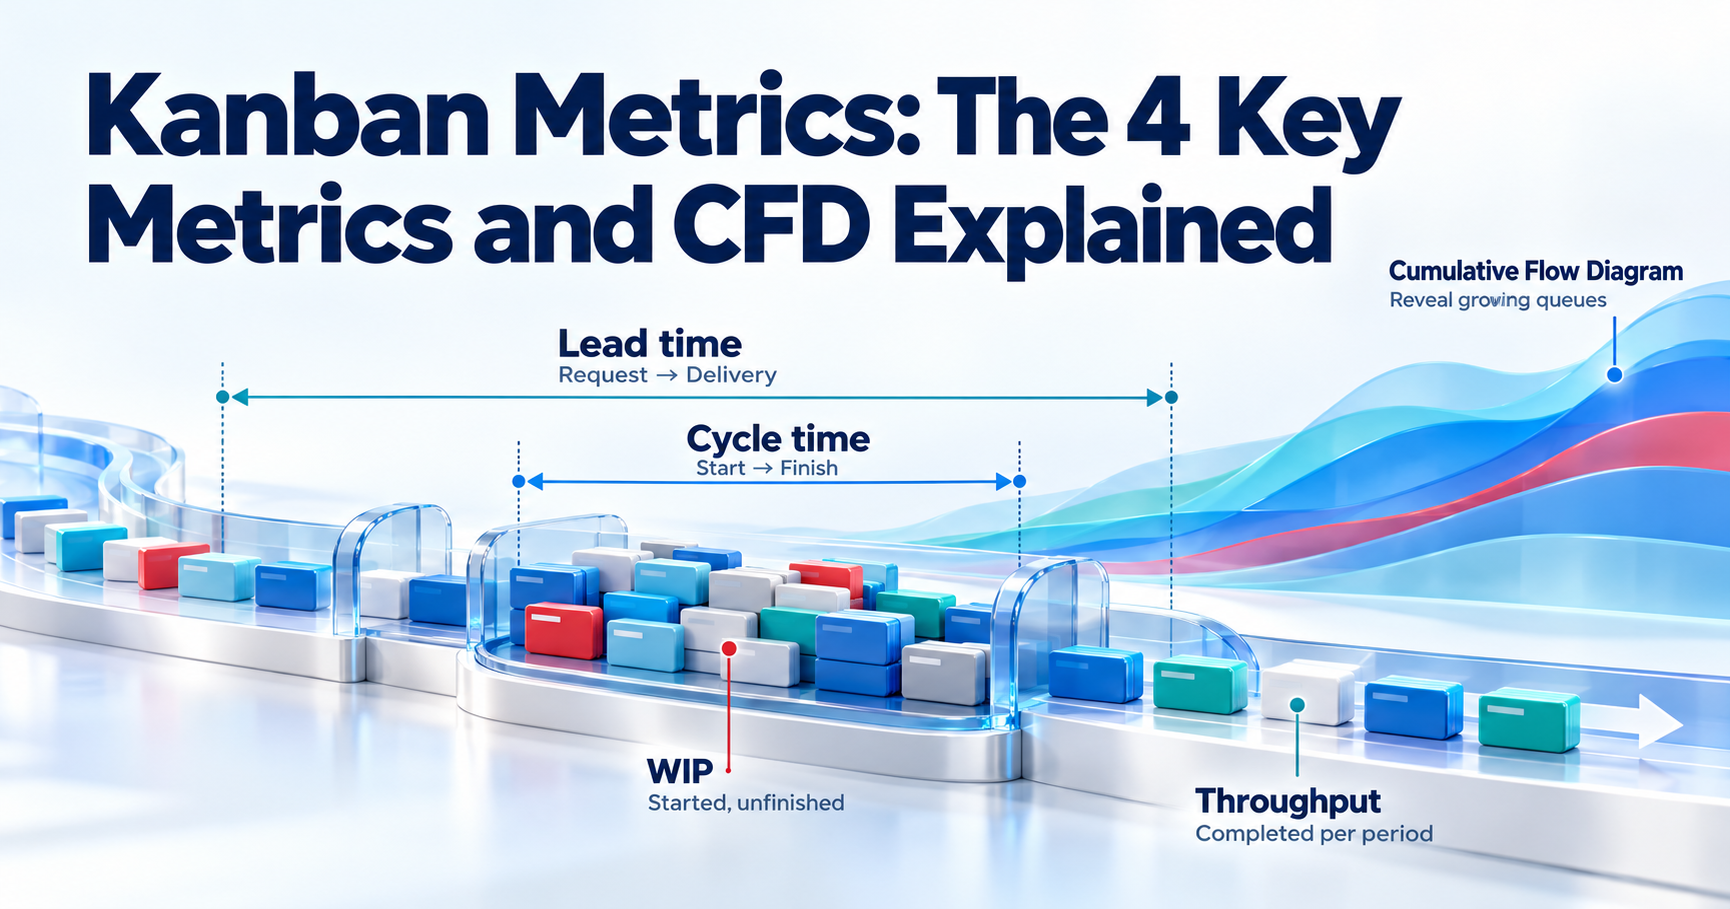
Image Drive Link:
Kanban Metrics: The 4 Key Metrics and CFD Explained
Kanban metrics show how work flows through your system. Lead time measures request-to-delivery time. Cycle time measures start-to-finish time. Throughput counts completed items per period, while work in progress (WIP) counts started but unfinished items. A Cumulative Flow Diagram (CFD) shows how work builds up and moves through the workflow over time.
Key Highlights of Kanban Metrics
- Define the start and finish points before comparing numbers
- Include waiting and blocked time when measuring elapsed cycle time
- Use throughput history to discuss delivery ranges
- Review WIP alongside ageing work and downstream capacity
- Use the CFD to investigate growing queues
- Apply Little’s Law to averages from the same workflow boundaries
Introduction
A team can have a full board, busy people, and very little finished work. During daily meetings, most tasks seem nearly finished. Yet by Friday, several are still waiting for testing, and customers are asking when they will be ready.
Kanban metrics make that situation easier to examine. They show whether delays occur before work starts, during delivery, or at a particular handoff. With consistent data, a team can choose a specific improvement and check whether it helped.
Consider a customer support team that handles account changes. Some requests take only a few minutes to process, but customers wait several days because approvals happen twice a week. Asking employees to work faster addresses only a small part of the delay. Measuring the whole journey reveals where a different approval policy could help.
What Are Kanban Metrics?
Kanban metrics are measures of work moving through a defined workflow, and they build on the core practices of Kanban such as visualizing work and managing flow.
This article focuses on four mostly used measures: lead time, throughput, cycle time, and WIP. There is a terminology distinction: the Kanban Guide’s minimum flow metrics are WIP, throughput, work item age, and cycle time. Lead time adds a broader customer perspective.
Work item age tracks how long an unfinished item has been in progress. Keep it visible alongside completed-work metrics so that stalled items receive attention.
A useful measurement needs a clear unit of work. A service desk may count resolved tickets; a marketing team may count approved campaign assets. If one card represents an entire campaign and another represents a single headline change, the total needs context. Keep the unit consistent enough for comparisons to mean something.
Metrics also serve different decisions. Current WIP helps the team decide whether to pull another item today. Historical throughput helps discuss how much may finish next month. Lead-time trends show whether the service is becoming more responsive. Reading those measures together is more useful than choosing one number as the team's performance score.
The 4 Key Kanban Metrics
Lead Time
Lead time answers: “How long did the customer wait?” Some organisations use a commitment point instead, so always label the boundary.
Lead time = Delivery timestamp − Request timestamp
A request received on 3 June at 10 a.m. and delivered on 13 June at 10 a.m. has a lead time of 10 calendar days. This includes the queue before the team begins.
Long lead time with short cycle time can indicate a backlog or prioritisation delay. Starting execution faster will not necessarily resolve a queue that grows because demand exceeds delivery capacity.
For customer-facing reporting, confirm what “delivered” actually means. If customers cannot use it yet, ending customer lead time at approval hides part of their experience.
Where demand contains many speculative ideas, distinguish an idea's creation date from a genuine service request. Otherwise, an old suggestion selected months later may distort a report intended to measure service responsiveness. Preserve both dates when they answer different business questions.
Cycle Time
Cycle time measures depend on times between starting and finishing an item. It includes reviews, testing, handoffs, and waiting within those boundaries. It is not a measure of hands-on effort.
Cycle time = Finish timestamp − Start timestamp
If the same requirement starts on 8 June at 10 a.m. and finishes on 13 June at 10 a.m., its cycle time is five calendar days. Two days spent waiting for approval remain part of those five days.
For several finished items, calculate the mean by dividing their total cycle time by the number of items. Also, inspect the spread: an average alone can hide unusually slow work.
Suppose five completed items have cycle times of 2, 3, 3, 4, and 18 days. Their mean is six days, while their median is three days. Both calculations are correct, but neither explains why one item took 18 days. That item deserves a closer look before anyone announces that a typical request takes six days.
Show the individual results alongside the summary. The slow item might expose an approval dependency affecting future work, or it might be an unusual request that belongs in a separate service category.
Throughput
Entirely the number of work items completed in a defined period. Report it as items per day, week, or another consistent interval.
Average throughput rate = Completed items ÷ Number of time periods
If a team completes 24 requests in four weeks, its average throughput is six requests per week. However, the number completed in each week may vary.
Count items that meet the agreed finish policy. Story points completed per sprint describe Agile velocity, not item-count throughput.Keep item types visible: a week dominated by minor fixes may not represent a week dominated by complex integrations.
Include quiet periods in your history. If a team finishes nothing in one week, record zero rather than removing that week. Excluding it makes the average look stronger than the service customers actually received.
Throughput can rise because delivery improves, because work becomes smaller, or because the mix changes. A higher count therefore needs interpretation. Ask whether the team delivered useful, acceptable outcomes and whether the item-counting policy remained consistent. Increasing throughput while defects and rework grow is not a convincing improvement.
Work in Progress (WIP)
WIP is all work that has started but has not finished. It includes blocked items and queues inside the chosen workflow. Unstarted backlog items sit outside that boundary.
WIP = Count of started, unfinished items at a given time
Suppose a board has three items in development, two awaiting review, and one in testing. Current WIP is six.
A WIP limit is the agreed maximum for a stage or the overall workflow. Setting and adjusting limits is a core skill in Applying Professional Kanban (APK).
WIP also has a time dimension. Six items that started yesterday present a different situation from six items that have been waiting for three weeks. The count describes inventory; work item age helps reveal the risk within that inventory.
When a column reaches its limit, discuss how to help work leave it. Moving blocked cards to an unmeasured area only makes the board look healthier. Keep those cards within the WIP count until they genuinely finish or leave the system under an explicit cancellation policy.
Lead Time vs Cycle Time
The Customer View vs the Team View
Lead time reflects the wait experienced by the requester; cycle time helps the team examine delivery after work starts. For a deeper comparison, see lead time vs cycle time.
Both include elapsed waiting within their respective boundaries.
| Measure | Starts | Ends | Main question |
| Lead time | Request received | Delivered | How long does the customer wait? |
| Cycle time | Work started | Agreed finish | How long does delivery take once started? |
When both share the same endpoint, lead time equals pre-start waiting plus cycle time. If the team finishes before release, customer lead time also includes that later release wait.
For example, imagine a recruitment request that waits nine days before a recruiter begins and then takes six days to complete. Customer lead time is 15 days; cycle time is six. Better interview coordination might reduce those six days, while a different intake policy might reduce the nine-day queue. The measures point to different discussions and different people who may need to help.
How to Measure Each Correctly
Record request, start, finish, and delivery timestamps separately where necessary. Choose calendar days or working days and state that choice beside the metric.
Do not pause the elapsed-time clock when an item is blocked. Record blocked duration separately to explain the delay. Agree how reopened and cancelled items are recorded, and preserve their history.
Use timestamp subtraction consistently. Counting both the start date and finish date as whole days can inflate results.
Before trusting an automated report, manually check a few cards against their event histories. Confirm that moving from Development to Review does not accidentally reset the start date, and that a temporary status change does not count an item as completed twice.
For distributed teams, use a consistent timezone in calculations. If you choose working days, define holidays and working hours as well. A calendar-day report and a business-day report can both be useful, but comparing them without labels creates confusion.
The Cumulative Flow Diagram (CFD)
What a CFD Shows
A CFD is a stacked area chart showing workflow states over time. For the SAFe perspective, see cumulative flow diagrams in SAFe.The horizontal axis shows dates; the vertical axis shows item counts. Each coloured band represents a state such as Development, Review, or Done.
At a selected date, the vertical thickness of a band shows how many items occupy that state. The thickness across all started-but-unfinished states represents WIP. A displayed backlog band is not automatically part of WIP.
A CFD needs historical information. Today's column totals alone cannot reconstruct how the workflow changed last week. A digital board can use status events; a physical board needs regular snapshots or another reliable record.
Check the chart's filters before reading it. If completed items disappear after a fixed period, or the report suddenly excludes one work type, its shape can change without any change in delivery behaviour. The chart should represent the same scope throughout the period being compared.
Reading Bands, Bottlenecks, and WIP Trends
Read changes across several dates, rather than judging one snapshot:
- A widening Review band means review inventory is growing
- A widening total WIP band means starts are outpacing finishes over that interval
- A flat cumulative Done boundary means no additional items finished during that interval
- Relatively consistent WIP thickness suggests inventory is broadly stable
A growing band identifies a place to investigate. It does not prove the cause. Review items might be waiting for a specialist, clearer acceptance criteria, or an external decision.
Here is a small illustrative set of board snapshots. Assume no items are cancelled or reopened, Done is cumulative, and the scope stays fixed.
| Snapshot | Development | Review | Test | Done | Total WIP |
| Monday | 4 | 2 | 2 | 20 | 8 |
| Wednesday | 4 | 5 | 2 | 23 | 11 |
| Friday | 3 | 7 | 2 | 26 | 12 |
Six items finished between Monday's snapshot and Friday's snapshot, yet unfinished inventory rose from eight to 12. Review accounts for the largest increase. The team is completing work, but it is also taking on work faster than it finishes it during this interval.
The table does not establish that reviewers are working slowly. Some review cards might lack required evidence or need a decision from outside the team. Inspect the cards before deciding whether to change staffing, policies, or intake.
Spotting Problems Early
Imagine Review grows from two items on Monday to seven on Thursday. Before pulling more development work, examine the waiting items and arrange help with reviews.
Pair the CFD with work item age. A stable total can hide an old item while newer work passes through. For individual cycle times, use item timestamps and a scatterplot; horizontal gaps on a CFD can mislead when items finish out of order.
Use a repeated signal to trigger a conversation rather than waiting for a deadline to slip. For example, if the Review band widens on several successive snapshots, ask which items are ready for review and what prevents them from moving.
A sudden jump across several bands calls for a different check. It may reflect a batch import, bulk status updates, or a reporting change. Verify the data before treating the jump as a delivery problem.
How Kanban Metrics Connect (Little's Law)
WIP = Throughput x Cycle Time
Little’s Law connects long-run averages for the same system:
Average WIP = Average throughput rate × Average cycle time
Suppose a reasonably stable workflow averages 12 unfinished items and completes three items per day. Its implied average cycle time is 12 ÷ 3 = four days.
Use matching units and boundaries. A daily throughput rate requires cycle time expressed in days. The relationship is about averages, not today’s WIP divided by yesterday’s completions.
For practical use, check that arrivals and departures broadly balance over time, WIP is not continually growing, and work does not remain indefinitely unfinished. Account for cancellations consistently. Short observation windows and major workflow changes can make the estimate unreliable.
You can rearrange the relationship to estimate average cycle time:
Average cycle time = Average WIP ÷ Average throughput rate
For a workflow averaging 15 items in progress and five completions per week, the implied average is three weeks. Dividing a WIP limit of 15 by that rate would not give the same evidence: the limit is a policy, while average WIP describes what actually happened.
Little's Law does not tell you which specific request will finish next. Two services can have the same averages and very different variations. Use item-level history and forecasting methods when the question concerns the likelihood of meeting a particular date.
Why Limiting WIP Improves Cycle Time
When throughput stays broadly unchanged, lower average WIP corresponds to lower average cycle time. Reducing WIP can also help people finish existing work by reducing competing demands for attention.
However, a lower limit is an experiment, not a guaranteed improvement. Set it too low and a constrained stage may lack ready work. Monitor completion rates, delays, and quality while adjusting the limit.
Also check customer lead time: simply moving a queue outside the measured start boundary can improve reported cycle time without shortening the customer’s wait.
A practical experiment is to lower the overall limit slightly and agree that people will help finish existing work when the limit is reached. Keep enough work available for the constrained stage, then observe what happens over a meaningful period.
If cycle time falls but throughput also drops sharply, investigate whether the new limit is starving part of the workflow. If neither changes, the main delay may sit elsewhere, such as a weekly approval meeting. Limits should guide improvement, not become a rule that the team follows without examining the result.
How to Track Kanban Metrics Step by Step
Setting Up Your Board and Columns
Start with the workflow people actually use. A simple board might contain Requested, Ready, Development, Review, Test, and Done. Mark where work starts and what qualifies as finished.
Write entry and exit policies for stages that generate confusion. For setup guidance, read What Is Kanban Board And How To Use It.
Make waiting visible where it affects decisions. A single “In Progress” column may be adequate for simple work, but it can conceal a large queue awaiting testing. Separate that queue if the team needs to manage it.
Avoid creating a column for every minor action. Too much detail makes maintenance difficult and encourages stale updates. Choose stages that expose meaningful handoffs or decisions. Then agree who updates a card and what evidence is required before moving it to Done.
Collecting and Visualizing the Data
Capture an item ID, work type, timestamps, status history, and blocker information. Update the board when work changes state; Friday catch-up updates distort the record.
A useful Kanban metrics dashboard can include:
- A CFD for inventory trends.
- A cycle-time scatterplot for completed items.
- Weekly throughput bars for delivery variation.
- Current WIP and work item age for daily decisions.
- Lead-time trends for the customer perspective.
Learning how to measure kanban metrics starts with reliable events and clear definitions. Software can calculate the numbers, but the team must check what its report includes.
Review the dashboard at different levels. In the daily discussion, look first at blocked or ageing items and capacity to finish them. In a periodic service review, examine trends in lead time, throughput, and WIP. During improvement discussions, compare the data before and after a policy change.
Keep simple filters for work type and service class. Urgent incidents may need separate analysis from planned improvements because their handling policies differ. However, continue to examine the combined workload: urgent requests still consume capacity and affect other delivery.
Setting Baselines and Improvement Targets
Collect enough representative history to see variation across normal weeks. Separating substantially different services when combining them would mislead.
Record the baseline, then choose a specific experiment. For example: “Review waiting time is increasing; for the next fortnight, review existing items before starting new development.”
Compare the result with the baseline while checking throughput and defects. This supports the incremental improvement approach discussed in Principles of Kanban.
Avoid importing another team's target without understanding its work. A two-day cycle time could be sensible for routine access requests and unrealistic for a service involving external validation. Set expectations from your own evidence, then discuss what would need to change to improve them.
Record the date of each experiment. If results improve, check whether demand, staffing, or item mix also changed. You may not be able to isolate every influence, but noting them prevents a confident explanation based on an incomplete picture.
Kanban Metrics Example
These illustrative kanban metrics examples use calendar days, identical times of day, and a shared finish/delivery point.
| Item | Requested | Started | Finished | Lead time | Cycle time |
| A | 1 June | 3 June | 6 June | 5 days | 3 days |
| B | 2 June | 4 June | 8 June | 6 days | 4 days |
| C | 3 June | 5 June | 10 June | 7 days | 5 days |
| D | 4 June | 7 June | 11 June | 7 days | 4 days |
Apply each Kanban metrics formula to the relevant data:
Average lead time: (5 + 6 + 7 + 7) ÷ 4 = 6.25 days.
Average cycle time: (3 + 4 + 5 + 4) ÷ 4 = 4 days.
Throughput for 5–11 June inclusive: 4 items that week.
WIP immediately after B finishes on 8 June: 2 items, C and D, assuming no other started work.
Average pre-start waiting is 6.25 − 4 = 2.25 days. Investigating that queue may improve lead time even if execution stays unchanged.
This kanban metrics calculation deliberately separates completed-item averages, a weekly count, and a point-in-time WIP snapshot. Those values are not interchangeable inputs for Little’s Law. Estimate average WIP from time-weighted inventory, or approximate it with evenly spaced observations, across a representative period.
The same four-item example can illustrate an exact WIP calculation over a carefully chosen window. Assume A through D are the only items in the system. Observe from immediately before A starts on 3 June until D finishes on 11 June, an elapsed period of eight days. WIP is zero at both boundaries.
The items contribute 3 + 4 + 5 + 4 = 16 item-days of unfinished inventory. Dividing 16 item-days by eight days gives an average WIP of two items. Four completions over eight days give a throughput rate of 0.5 items per day.
The relationship is then consistent:
2 items = 0.5 items per day × 4 days
This is a closed example with all work observed from start to finish. A live team's report usually contains items that began before the reporting window or remain unfinished afterwards. That is why a convenient weekly snapshot should not be substituted for a carefully measured average.
Using Kanban Metrics to Improve Flow
Forecasting Delivery With Throughput
Suppose recent weekly completions were 5, 7, 6, 4, 8, and 6 items. Average throughput is six per week. For 24 remaining items, 24 ÷ 6 gives a rough four-week estimate.
That is not a promised date or a confidence-based forecast. A Monte Carlo simulation can repeatedly sample historical throughput to produce a range of completion dates and probabilities. Its usefulness depends on whether that history represents the likely future workload and conditions.Scrum.org explains how to use flow metrics to optimize product delivery, including probabilistic forecasting.
Revisit forecasts when scope, capacity, or work mix changes. Count remaining work consistently; do not split tickets merely to improve the forecast.
When presenting a forecast, state the question clearly. “How many requests might finish in the next four weeks?” differs from “When might these 24 requests finish?” The first has a fixed time window; the second has a fixed scope.
For a fixed-scope forecast, explain whether urgent arrivals can interrupt the planned work. Historical throughput may already reflect some interruptions, but a new support obligation could change that pattern. A forecast remains useful when its assumptions are visible and updated as circumstances change.
Reducing Cycle Time and Variability
Inspect the slower items individually. Were they waiting for access, unclear requirements, or a shared testing environment? Choose an action that addresses the observed delay.
Smaller deliverable items, clearer acceptance criteria, and quicker review availability are possible experiments. Track whether the spread narrows as well as whether the average falls.
For example, an historical 85th-percentile cycle time of eight days means about 85% of measured items finished within that duration, depending on the percentile method. It offers a probabilistic reference for similar work, not a guarantee. Review it alongside ageing unfinished items.
Separate legitimate differences from avoidable inconsistency. A security investigation may naturally take longer than a password reset. Combining them into one percentile can make the result unhelpful for both services. Segment where the difference changes a decision, while retaining a view of shared capacity.
Do not remove slow items merely to make the chart neater. Check for recording errors first. If the record is correct, the delay is part of the service's history and may reveal a risk worth managing.
Common Mistakes to Avoid
Chasing Utilization Over Flow
Keeping everyone occupied can create queues when each person starts more work instead of helping finish existing items. A developer assisting with a review may improve delivery more than starting another feature.
Avoid individual throughput rankings. They encourage easy-ticket selection and overlook collaboration. Assess delivery alongside quality and customer outcomes.
There is also a cost to asking specialists to stay fully booked. If every reviewer has a full allocation of other tasks, newly completed development may wait until someone becomes available. Some capacity to respond to changing demand can protect the flow of work through the whole service.
Discuss that trade-off openly. A person who is briefly available is not necessarily evidence of waste, especially when their availability prevents a larger queue from forming elsewhere.
Measuring Without Acting
A dashboard has limited value if nobody changes a decision. During reviews, choose one observed problem, agree on an experiment, and set a date to examine the result.
Keep definitions stable during comparisons. Excluding blocked tickets, changing the finish point, or mixing different services can create apparent improvements that customers never experience.
Give each experiment a clear next action. “Improve flow” is too broad to review. “Check the oldest review items together each morning for two weeks” describes a behaviour the team can actually try.
At the review date, ask whether waiting was reduced, whether completion rates changed, and whether quality remained acceptable. Keep, adjust, or stop the experiment based on the result. A useful metric earns its place by informing those decisions.
The Scrum Master's Role With Kanban Metrics
A Scrum Master helps the team interpret evidence, surface impediments, and agree on improvement. For example, a growing testing queue can prompt a discussion about dependencies and how the team shares work.Scrum.org’s Kanban Guide for Scrum Teams explains how these metrics fit inside Scrum.
Using Kanban metrics in Scrum teams is the focus of Professional Scrum with Kanban (PSK) training, which preserves Scrum’s goals and accountabilities. The Scrum Master facilitates that learning; the team participates in owning its workflow.
For a broader view, explore Flow Metrics. Professionals working in a SAFe environment can also explore Simpliaxis’ SAFe Scrum Master Certification Training.
In a retrospective, the Scrum Master might bring three unusually slow items and ask the team to trace their journeys. The discussion can reveal a repeated dependency that a team-level average concealed. The next step may involve the Product Owner, another team, or a manager who can resolve the constraint.
Be careful with the language used around the data. “What kept this item waiting?” invites investigation. “Who caused this number?” encourages defensive reporting. Reliable metrics depend on people being comfortable showing unfinished, blocked, and unexpectedly difficult work.
Conclusion
Start with clear boundaries and trustworthy timestamps. Review lead time for the customer’s wait, cycle time for delivery duration, throughput for completions, and WIP for unfinished inventory. Use the CFD to find growing queues, then inspect the work behind them.
Choose one improvement and check its effect on delivery and quality. That routine makes the measures useful.










 Lowest-Price Challenge












 Personalized Path



.webp)


 USA
 Canada
 India
 UK
 Australia
 Singapore


