


 Call Us




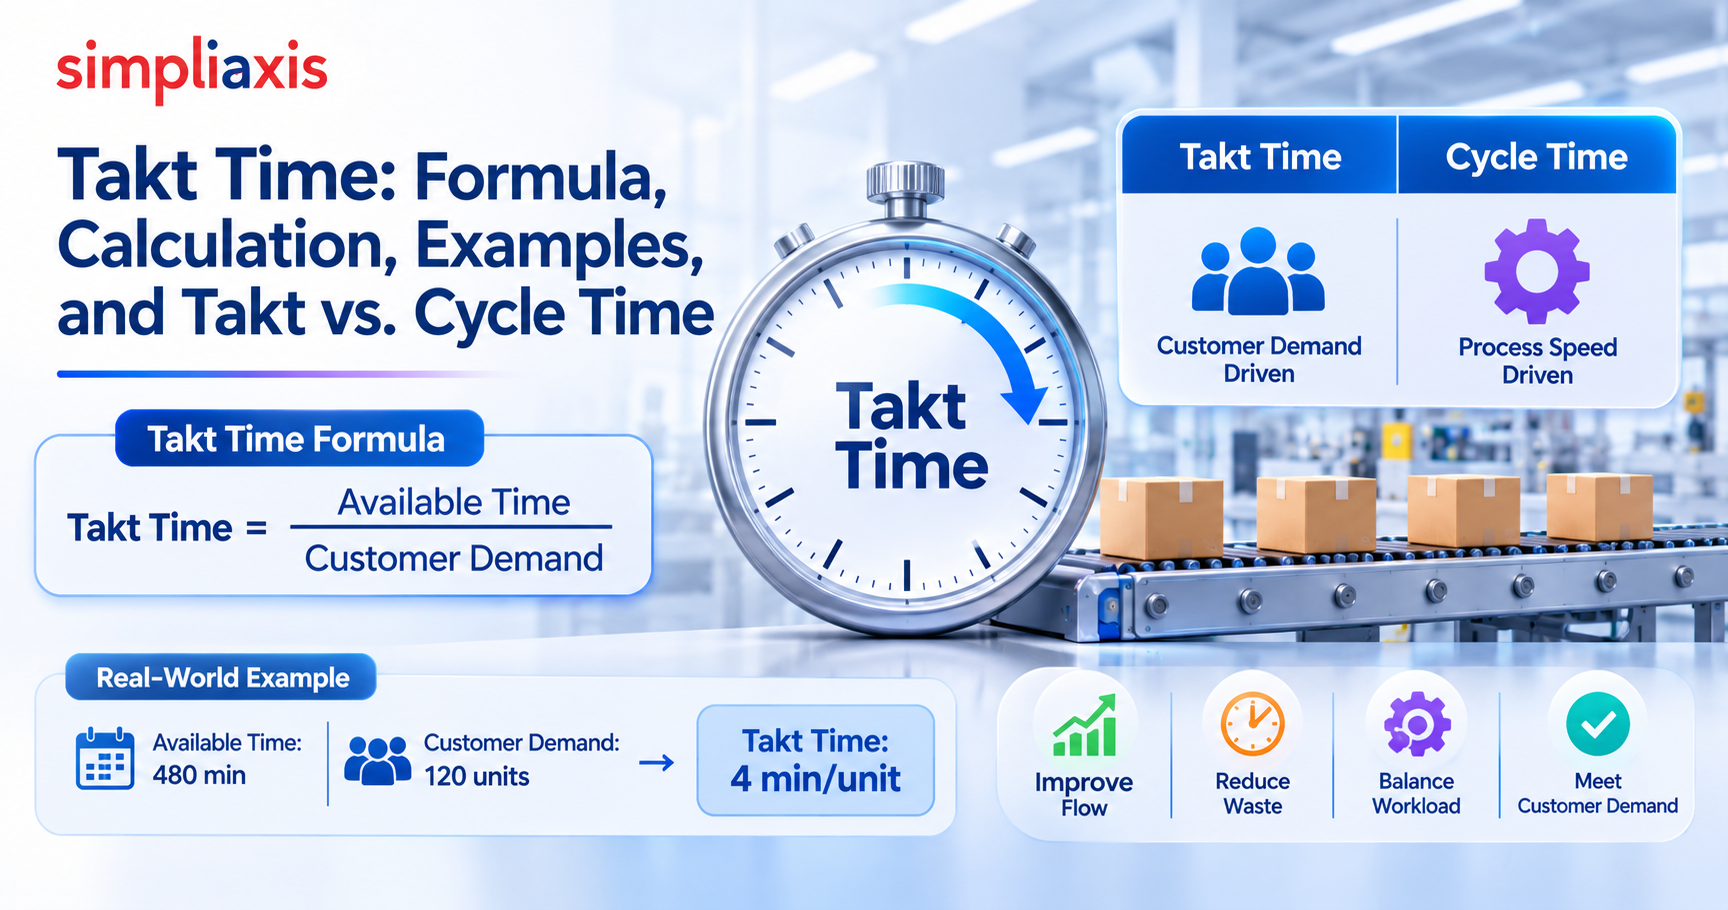
Takt time is the pace at which a process must finish one unit to meet customer demand. To calculate it, divide net available production time by customer demand for the same period.
For example, 420 minutes of production time and demand for 210 units gives a takt time of 2 minutes per unit. It is a target rhythm, not a measure of how fast your process actually runs.
Takt Time = Net Available Production Time ÷ Customer Demand
Key Highlights of Takt Time
- Takt time measures the required pace of production, set by customer demand rather than by what the process can currently do.
- The takt time formula divides net available time by demand, and both inputs must cover the same period.
- Cycle time is how long work actually takes, so comparing it with takt time shows whether a process can keep up.
- Takt time supports line balancing by showing which stations carry more work than the required pace allows.
- When cycle time exceeds takt time, you have an early warning of a capacity gap, and value stream mapping helps you find the cause.
Introduction
Imagine a plant that needs to ship 210 pumps a day. One week the team finishes 180 on Monday, 240 on Tuesday, and 150 on Wednesday. Nobody is slacking, yet stock-outs, overtime, and idle hours all appear in the same week. The underlying problem is that the team has no shared rhythm tied to what customers actually need.
That is the gap takt time closes. It converts customer demand into a clear target pace, so operators, supervisors, and planners can see at a glance whether the process is running ahead of, behind, or in step with the market. Used well, it sharpens production planning, protects throughput, and exposes constraints before they turn into late orders.
This guide explains the takt time formula in plain language and walks through takt time calculation examples for single and multiple shifts. It shows how takt compares with cycle time and lead time, how to use it for line balancing and staffing, which mistakes distort the result, and where it fits in Lean Six Sigma projects, value stream mapping, and software teams. If you are new to the wider framework, start with our overview of what is the lean process, then return here for the detail.
What Is Takt Time?
To define takt time simply: it is the maximum time you can spend producing one unit if you want to satisfy customer demand exactly. The Lean Enterprise Institute’s takt time entrydefines it as available production time divided by the rate of customer demand. The answer is expressed as time per unit, such as 2 minutes per unit or 90 seconds per unit.
A common search is for the takt time full form. Takt is not an acronym, so there is nothing to expand. The word is German for beat, pulse, or rhythm, the same word used for the beat a conductor sets in music. Takt time on Wikipedia traces its industrial use to German aircraft manufacturing in the 1930s. Toyota later made it a core idea in the Toyota Production System, and it spread across Lean organisations from there.
In practice, takt works like a metronome for a process. It answers one question: how often must a finished unit leave this process if we are to meet demand? Three features set it apart from other time measures:
- It is demand-driven: The number comes from customers, not from machine speed or operator skill.
- It is a target: Takt tells you what pace is required, not what pace you currently achieve.
- It is period-specific: It changes when demand or available time changes, so it should be reviewed regularly.
Because takt is a rhythm rather than a speed record, running faster than takt does not help. It simply builds inventory, which is one of the seven wastes of Lean.
Takt Time in Manufacturing
Takt time in manufacturing sets the pace for an assembly line or work cell. Planners calculate manufacturing takt time from the shift’s net production minutes and the demand for the period, then compare each station’s cycle time against it. Stations that run slower than takt hold up the line, while stations that run much faster than takt are idle for part of every cycle.
Takt also anchors standard work. Once the required pace is known, teams document the sequence, timing, and quantity of work at each station so that the same output can be repeated shift after shift. Most plants recalculate takt when demand shifts meaningfully, often monthly or quarterly, rather than redesigning the line every day.
Takt Time in Services and Software
The idea travels beyond factories, but it needs care. In a service operation, the “unit” might be a completed insurance claim or support case. In a software team, it might be an agreed work item. The difficulty is that these units vary in size and complexity far more than identical products on an assembly line.
For that reason, service and software teams usually pair takt with measured cycle time and throughput, rather than treating every unit as interchangeable. The table below shows how the same logic maps to different settings.
Context | Example unit | Demand represents |
| Manufacturing | Finished product | Units required in a period |
| Service operations | Completed case | Cases to process in a period |
| Software teams | Defined work item | Agreed delivery demand over a period |
Use the table to see the pattern, not to assume that every work item is the same size. Where work varies a lot, takt is a planning reference rather than a precise promise.
Takt Time Formula
The takt time formula is one of the simplest in operations management:
Takt Time = Net Available Production Time ÷ Customer Demand
Net available production time is the time the process is genuinely scheduled to produce in the chosen period. Customer demand is the number of units customers require in that same period. The Lean Enterprise Institute uses the same structure, which is why this formula is the standard reference in Lean practice.
The formula only works if the two inputs describe the same window. Daily demand needs daily available time, and weekly demand needs weekly available time. Mixing periods is the most common reason a takt time calculation produces a misleading answer.
Input | Meaning | Example |
| Net available production time | Time available for production in the chosen period | 420 minutes |
| Customer demand | Units required in that same period | 210 units |
| Takt time | Available time divided by demand | 2 minutes per unit |
Available Working Time
Available time is the time on the clock that the process can actually be producing. Start with gross time, such as an 8-hour shift of 480 minutes, then subtract planned stoppages that are not production time. Typical deductions include meal and rest breaks, team meetings, planned maintenance, scheduled cleaning, and start-of-shift checks.
For example, 480 minutes minus a 30-minute meal break, two 10-minute rest breaks, and a 10-minute team meeting leaves 420 minutes of net available time. Document these deductions in your standard work so everyone calculates takt the same way.
Unplanned downtime is treated differently. It is usually not removed from takt, because takt expresses what customers need. Downtime shows up later, when you compare takt with actual capacity and cycle time.
Customer Demand
Customer demand is the quantity customers require during the period, based on confirmed orders, a forecast, or a blend of both. Use real demand rather than what the process happens to produce, and rather than a batch size chosen for convenience. Inflating demand to hide problems turns takt into a comfortable fiction.
In production planning, teams sometimes adjust demand for expected scrap or planned inventory changes. If you do, document the adjustment openly so readers can see which number is customer demand and which is a planning buffer.
How to calculate takt time in six steps:
- Choose the time period, such as one shift, one day, or one week.
- Calculate net available production time by subtracting planned stoppages from gross time.
- Establish customer demand for the same period.
- Make sure units are consistent, for example, minutes with minutes or seconds with seconds.
- Divide net available time by customer demand.
- Interpret the result as the pace at which one unit must be completed.
Takt Time Calculation Examples
Worked examples make the takt time formula easier to apply. The three below use illustrative numbers, so replace them with your own shift patterns and demand. Each shows the inputs, the calculation, the units, and what the answer means.
Single-Shift Example
A workshop runs one 8-hour shift. Customers need 210 units per day.
- Step 1, gross time: 8 hours × 60 = 480 minutes.
- Step 2, planned stoppages: 30 minutes meal break + 2 × 10 minutes rest breaks + 10 minutes team meeting = 60 minutes.
- Step 3, net available time: 480 − 60 = 420 minutes.
- Step 4, customer demand: 210 units.
- Step 5, takt time calculation: 420 minutes ÷ 210 units = 2 minutes per unit.
The process needs to complete one unit every 2 minutes on average to match the stated demand, under the assumptions used here. Expressed in seconds, that is 120 seconds per unit.

If the slowest station actually takes 2.5 minutes per unit, the line can produce only 168 units in 420 minutes (420 ÷ 2.5). That leaves a shortfall of 42 units a day against demand, and the gap is visible immediately because takt gave you a benchmark.
Multi-Shift Example
Now suppose the plant runs two shifts, each with 450 minutes of net available time, and daily demand is 600 units. Be explicit about whether you are calculating per shift or for the combined production period, because both are valid but give different views.
- Combined period: 900 net minutes ÷ 600 units = 1.5 minutes per unit.
- Per shift, if demand is split evenly: 450 minutes ÷ 300 units = 1.5 minutes per unit.
Both views agree here because the demand is split evenly. If only the first shift ran all 600 units, takt would drop to 0.75 minutes (45 seconds) per unit, which is a very different line design. Adding a shift is one way production planning can lengthen takt and reduce pressure on each station.
Converting to seconds is often useful on the floor: 1.5 minutes is 90 seconds per unit. We use that figure again in the line-balancing example later.
Sample Calculation Table
The table applies the same takt time formula to three illustrative scenarios.
Scenario | Net available time | Demand | Takt time |
A | 420 minutes | 210 units | 2 minutes/unit |
B | 450 minutes | 300 units | 1.5 minutes/unit |
C | 360 minutes | 120 units | 3 minutes/unit |
The values are illustrative. Notice that scenario C has the least available time yet the longest takt, because its demand is much lower. Takt is driven by the ratio of time to demand, not by either number alone. Once you have the result, compare it with measured cycle time, as the next section explains.
How to interpret the result:
- A lower takt time means a faster required pace.
- A higher takt time means a slower required pace, assuming the period is unchanged.
- Compare the result with measured cycle time and process capacity.
- A takt-time target alone does not guarantee that demand can be met.
Cycle Time and Takt Time Compared
Cycle time and takt time are often confused because both are measured in time per unit. The difference is that takt time is what the customer requires, while cycle time is what the process delivers. Comparing the two is one of the quickest ways to test whether a process can meet demand.
When discussing cycle time vs takt time, keep the definitions consistent:
- Takt time: the required pace, based on net available time and customer demand.
- Cycle time: the time taken to complete a unit or process cycle, or the interval between completions, depending on how your organisation defines and measures it.
- Lead time: the elapsed time from a defined start point to a defined end point.
Process time is a related term. It is the time spent actually working on a unit, while cycle time may also include waits within the step. Whichever definition you choose, state it so everyone measures the same thing.
Here is a short example of how the metrics differ. A station has a takt time of 2 minutes and a measured cycle time of 1.8 minutes, so it keeps pace. A unit still takes 3 days from order to shipment because it waits in queues between steps. Takt is 2 minutes, cycle time is 1.8 minutes, and lead time is 3 days.
Lead Time vs Cycle Time vs Takt Time
The cycle time, takt time, and lead time relationship comes down to what each answers. Takt is the target for how often a unit must be completed. Cycle time is how long a step or process takes. Lead time is how long the whole journey takes, including waiting. A process can have a short cycle time and a long lead time if work sits in queues, which is why lead time often exposes waste that cycle time hides.
Our guide tolead time vs cycle timeexplains how these measures reveal flow and delays,and it pairs well with this section.
Comparison Table
Metric | What it measures | Key question |
| Takt time | Required pace based on demand | How often must a unit be completed to meet demand? |
| Cycle time | Actual time taken for a defined cycle or unit | How long does the process take? |
| Lead time | Elapsed time across a defined process | How long does the whole journey take? |
When cycle time exceeds takt time:
- The process may not have enough capacity to meet demand.
- A bottleneck or uneven work distribution may need investigation.
- The team may need to reduce avoidable delays, rebalance work, or add capacity.
- Decisions should rest on process data, quality, and constraints, not on takt time alone.
When cycle time and takt time are close, small disruptions matter. Many teams aim for a cycle time somewhat below takt so the process can absorb normal variation without missing demand.
How to Use Takt Time to Balance Work?
Takt time becomes most useful once you use it to compare work content with demand. It is a reference point for allocating work across stations or process steps, but it does not automatically tell you how the work should be distributed. Task dependencies, equipment, skills, and quality requirements all shape what is possible.
Line Balancing
Line balancing means distributing tasks across workstations so that each carries a similar amount of work, ideally at or just below takt. A balanced line avoids the pattern where one station is overloaded while its neighbours wait. An unbalanced line usually has a bottleneck, the station whose slower pace limits the output of the whole line.
The table shows a simple, illustrative line-balancing example using the 90-second takt from the multi-shift calculation earlier.
Workstation | Illustrative work content | Compared with 90-second takt |
A | 75 seconds | Below takt time |
B | 105 seconds | Above takt time |
C | 80 seconds | Below takt time |
Station B takes 15 seconds longer than takt allows, so it caps the line and needs investigation. Stations A and C have 15 and 10 seconds of spare time. One option is to move a task of about 15 seconds from B to A, which would bring both stations to 90 seconds. Whether that is feasible depends on task order, equipment, operator skills, and quality checks, so test the change rather than assume it.

Standard work helps here. When each task is documented with its sequence and timing, it is far easier to see which tasks can move and which cannot. Our guide to the seven wastes of Lean is a useful companion, because waiting, motion, and overprocessing are common causes of uneven stations.
Staffing Decisions
Takt time also informs staffing. A common planning estimate is total work content divided by takt time. In the example above, total work content is 75 + 105 + 80 = 260 seconds. Dividing by a 90-second takt gives about 2.9, so three operators or stations is the minimum starting point.
Treat that number as a lower bound, not a final answer. Real staffing must also allow for variation, absences, skill coverage, and the bottleneck itself. When demand rises and takt shortens, the same arithmetic shows when you need extra people, equipment, or a second shift to protect throughput. When demand falls, it shows where you can redeploy people rather than run stations below capacity.
Practical steps to apply takt:
- Measure current work content and cycle times at each step.
- Identify bottlenecks by comparing each cycle time with takt.
- Examine uneven task distribution and avoidable delays.
- Test a potential improvement, such as moving a task or adding a fixture.
- Re-measure performance and quality before standardising the change.
These steps follow the same logic as any process improvement effort: measure, analyse, change, check, and then lock in what works.
Common Takt Time Mistakes
Takt is simple to calculate, which makes it easy to calculate incorrectly. The mistakes below are the most common, and most can be avoided with a short checklist.
Mistake | Why it matters | Better approach |
| Using gross shift time | Overstates available production time | Calculate net available time consistently |
| Mixing time periods | Produces a misleading result | Match available time and demand periods |
| Ignoring demand variation | The target may no longer reflect demand | Recalculate when assumptions change |
| Treating takt as cycle time | Confuses required pace with actual performance | Measure both separately |
| Ignoring bottlenecks | A target does not create capacity | Investigate constraints and variation |
Using Gross Instead of Net Time
The most frequent error is applying the takt time formula to the full shift length. An 8-hour shift is 480 minutes, but if only 420 are genuinely available, dividing 480 by demand understates takt.
In our example, 480 ÷ 210 gives 2.29 minutes instead of the correct 2 minutes. That 14 percent gap means the plant plans a pace it cannot hold, and shortfalls appear only when it is too late to react.
Calculate available time the same way every time, document each deduction, and use the same definition across teams so that numbers can be compared.
Ignoring Demand Variation
Demand is rarely flat. Seasonal peaks, promotions, and large orders can make last month’s takt wrong for this month. If you set takt once and never revisit it, the process drifts away from customers, causing overproduction in slow periods and bottlenecks and late orders in busy ones.
Two habits help. First, recalculate takt on a fixed schedule and whenever demand shifts materially. Second, smooth the mix and volume of work where you can, a practice Lean calls heijunka. The Lean Enterprise Institute’s heijunka entry explains how levelling production reduces swings that overload specific stations.
Quick checklist before you trust a takt number:
- Confirm the time period.
- Verify the demand figure and its source.
- Calculate net available time, not gross time.
- Use consistent units throughout.
- Compare the result with measured cycle time and actual performance.
Takt Time in Lean Six Sigma Projects
In a Lean Six Sigma project, takt time gives the team a demand-based reference for judging process performance. During the Measure and Analyze phases, teams compare each step’s cycle time with takt to see where the process falls short. In Improve, takt helps set targets for rebalanced work. In Control, it is monitored so that gains hold as demand changes. If you want to see how these phases fit together, read our overview of Lean Six Sigma principles.
Furthermore, if you want to know more about measurement concepts that are beyond takt, see our guide toSix Sigma metrics.
Takt is one of severalLean Six Sigma tools, each with a different job. The table shows how they relate.
Toworkflowcept | Purpose |
| Takt time | Establishes the required pace based on demand |
| Value stream mapping | Makes material and information flow visible |
| Standard work | Defines an agreed way to perform a task |
| Kanban | Helps visualise and manage workflow |
| Bottleneck analysis | Identifies constraints limiting process performance |
Practitioners studying for certification meet takt time in the Lean content of programmes such as the Lean Six Sigma Green Belt certification.
Moreover, you can also test your understanding with the Lean Six Sigma Green Belt practice test.
Takt Time and Value Stream Maps
Value stream mapping shows every step in a process, including the waiting between steps, with data such as cycle time and lead time for each. Adding takt time to the map gives you a benchmark: any step with cycle time above takt is a candidate bottleneck, and any long queue between steps points to avoidable lead time. Our guide tovalue stream mappingexplains how to draw and read these maps.
A typical pattern is a map showing a 2-minute takt, steps with cycle times between 1.2 and 2.5 minutes, and several days of work-in-progress between them. The 2.5-minute step is the constraint, while the queues explain why lead time is days when cycle time is minutes. Fixing the constraint and reducing the queues attack two different problems.
For background on how this thinking developed, you can check out the references below:
Takt in Agile and Software Teams
Software work is knowledge work, and items differ in size and uncertainty. A bug fix and a new feature are not equal units, so treating every ticket as one manufactured part can mislead. Most Agile teams therefore rely on measured cycle time and throughput, and use takt-like thinking as a planning reference. A fixed sprint cadence is one example of rhythm set by the team.
A Kanban board makes this practical. Limiting work in progress, tracking how long items take to move from start to finish, and measuring how many items are completed per week show whether flow is steady. If the team agrees to deliver a certain number of items a month, dividing available working days by that number gives a rough takt, which can be compared with actual cycle time. Our guide to the core practices of Kanban covers the flow principles in more detail.
Keep the claim modest: takt time in software is a way to start a conversation about pace and capacity, not a precise promise.
Conclusion
The takt time formula, net available production time divided by customer demand, gives any team a clear, demand-based pace. Takt tells you how fast work needs to move, cycle time tells you how fast it actually moves, and the gap between them points to bottlenecks, uneven work, and capacity problems. Used for line balancing and staffing, it turns a target into practical decisions.
Remember that the result is only as reliable as your available-time and demand assumptions. Calculate net time, match your periods, review takt as demand changes, and always compare it with measured performance before acting.








 Lowest-Price Challenge












 Personalized Path



.webp)


 USA
 Canada
 India
 UK
 Australia
 Singapore


