


 Call Us




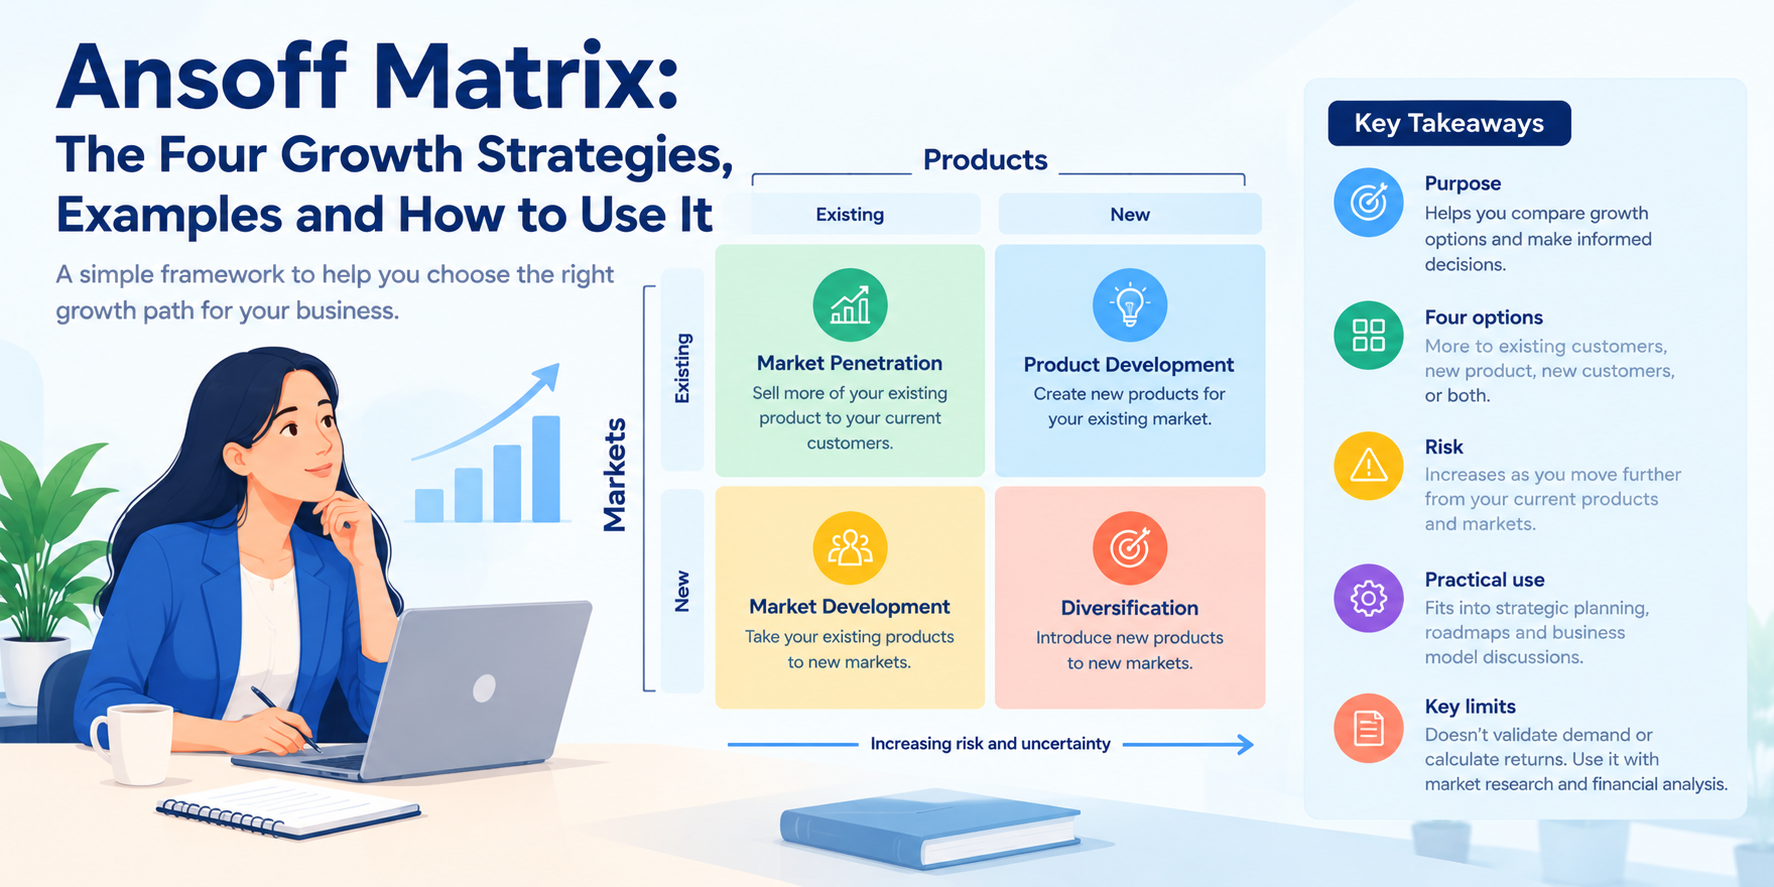
The Ansoff matrix is a strategic framework that helps businesses choose a growth direction by asking two questions:
Is the product existing or new?
Is the market existing or new?
The answers produce four options:
Market penetration (existing product, existing market),
Product development strategy (new product, existing market),
Market development (existing product, new market), and
Diversification strategy (new product, new market).
Risk generally rises as a business moves further from what it already knows.
Key Highlights of Ansoff Matrix
- Purpose: The Ansoff matrix organises growth options into four groups so teams can compare them on equal terms instead of debating them in isolation.
- Four options: Sell more of the same product to the same customers, build something new for them, take the product to new customers, or do both at once.
- Risk: Uncertainty usually increases with each step away from existing products and markets, with diversification carrying the greatest combined unknowns.
- Practical use: It fits naturally into strategic planning, from annual goal setting to product roadmap discussions, as a way to generate and sort options.
- Reading the grid: A clear Ansoff matrix diagram makes the two dimensions, products and markets, visible at a glance.
- Limits: The framework does not validate demand or calculate returns, so it works best alongside customer research and financial analysis.
Introduction
Every growing business eventually reaches the same fork in the road. Existing customers keep buying, but growth is flattening. Leadership meetings fill with competing ideas: push harder on the current product, build something new, chase customers in another city or country, or bet on an entirely different line of business. Each idea sounds reasonable on its own, and each one draws on the same limited pool of money, talent, and attention.
Without a shared structure, these debates tend to be settled by whoever argues loudest or whoever last read a persuasive case study. That is a poor way to commit months of effort. A framework does not make the decision for you, but it forces a team to name the choices, compare them on the same terms, and see where the biggest unknowns are hiding. That is the job of the Ansoff matrix, one of the most widely taught tools in business schools and boardrooms alike.
The Ansoff matrix sorts growth options into four groups based on how new the offering is and how new the customer is. A company selling more of the same thing to the same people faces a different kind of challenge from a company launching an unfamiliar product to an unfamiliar audience, even if both are labelled “growth”. Separating those challenges early helps leaders match ambition to capability, which sits at the heart of any sound growth strategy.
The framework is just as useful outside the boardroom. Marketing teams use it to decide where to point a campaign budget, and product teams use it to frame roadmap bets. Founders use it to stop one promising idea from spiralling into five half-finished ones. Wherever limited resources meet many possible directions, a clear map of business growth strategies pays for itself.
This guide covers what the model is and where it came from, how each of the four strategies works, how to read the diagram and interpret risk, and a step-by-step process for applying it. You will also find worked examples, a comparison with other tools, honest limitations, and advice for product owners. The aim is practical: by the end, you should be able to run an Ansoff session with your own team and leave with a defensible shortlist rather than a wish list. Where an example is hypothetical, or where a company’s quadrant is our interpretation rather than a stated fact, the text says so. Good marketing strategy and good product strategy both begin with that kind of honesty about what is known and what is assumed.
What Is the Ansoff Matrix?
The Ansoff matrix is a two-by-two framework that helps organisations decide how to grow. The standard Ansoff matrix definition is simple: it classifies growth options by crossing two dimensions, products (existing or new) and markets (existing or new). Each of the four resulting cells is a distinct strategic direction, with its own level of uncertainty, investment, and required capability. Because the Ansoff matrix model asks only two questions, it is easy to explain, easy to draw on a whiteboard, and easy to revisit when conditions change.
You will see the tool described under several names. Some sources call it the product market grid, since it literally maps products against markets. Others use the Ansoff growth matrix or the Ansoff strategic opportunity matrix. These all describe the same idea, and this article uses them interchangeably where it reads naturally.
The two dimensions deserve precise definitions, because most disagreements in an Ansoff workshop come from fuzzy ones:
- Product means what you sell, including its features, quality, service, and the way it is delivered. A product is “new” when it differs enough that customers, operations, or technology must change to support it. A minor cosmetic refresh usually does not count.
- Market means the group of customers you serve, along with the geography and channels through which you reach them. A market is “new” when you are selling to people you do not serve today, or through channels you have never used.
Crossing the two gives the grid below.
Existing products | New products | |
| Existing markets | Market penetration: sell more of what you have to the customers you already serve | Product development: create new or improved offerings for current customers |
| New markets | Market development: take current products to new segments, regions, or channels | Diversification: launch new products into new markets |

It helps to treat the matrix as an organising tool rather than a calculator. It does not tell you which cell offers the highest return, and it does not prove that customers want anything. What it does is make sure a team considers every direction, separates different kinds of risk, and discusses them in the same vocabulary. For a neutral overview of the framework, see the Ansoff matrix on Wikipedia.
Origin and Igor Ansoff
The framework comes from Igor Ansoff, a Russian-born American applied mathematician and business theorist who is often called one of the founders of strategic management. Ansoff worked in industry and research before moving into academia, and his writing helped shift corporate planning from simple budgeting toward a deliberate study of how firms choose their direction. A short biography is available in Igor Ansoff on Wikipedia.
The Igor Ansoff matrix first appeared in his 1957 Harvard Business Review article, “Strategies for Diversification”, which you can read in an archived copy of Ansoff’s 1957 HBR article. The article set out the four product-and-market combinations that managers face when they want to grow. He developed the thinking further in his 1965 book, Corporate Strategy, which brought the grid to a much wider audience of executives and students.
A short Ansoff matrix explanation of why it lasted: it answers a question every organisation asks, in a form anyone can draw. Most strategy tools of the era required extensive data. Ansoff’s grid required only a clear view of what the company sold and to whom, which is why it remains a staple more than six decades later.
Ansoff Growth Matrix vs Product Portfolio Models
The Ansoff growth matrix is sometimes confused with portfolio tools, but the two answer different questions. The Ansoff matrix is about direction: where could we grow next? Portfolio models are about allocation: given what we already own, where should we invest, hold, or withdraw?
The best-known portfolio model is the growth-share matrix, widely called the BCG matrix after the Boston Consulting Group, where it originated. It plots each product or business unit by market growth rate and relative market share, then sorts them into categories such as stars, cash cows, question marks, and dogs. That is a diagnosis of a current product portfolio, not a menu of future moves. If you want to see how portfolio evaluation works in practice, our guide to product portfolio analysis walks through the method.
The two tools complement each other well. A portfolio review may show that a mature product is generating cash but has little room to grow, which prompts an Ansoff question: should we take it to new markets, or reinvest in new products for the same customers? Later sections compare the frameworks side by side.
The Four Strategies of the Ansoff Matrix
Each quadrant of the Ansoff matrix represents a different kind of bet. The four strategies below move from the most familiar territory to the least, which is also the order in which many businesses exhaust them. One caution before the details: no strategy is the best growth strategy in the abstract. A mature supplier with strong distribution may gain the most from market penetration, while a company with a loyal customer base and a capable engineering team may find product development more productive. Resources, capabilities, market conditions, and objectives decide which option deserves investment. Most successful companies also run several strategies at once, weighted differently over time.
Market Penetration
Market penetration means selling more of your existing products to your existing market. There is no new product and no new customer segment. Growth comes from deepening your hold on the territory you already know, which makes it the quadrant where evidence is easiest to gather, and execution is easiest to control.
There are four main levers. You can win customers from competitors, which is a competitive strategy question about why buyers should switch. You can persuade current customers to buy more often or in larger quantities. You can convert people inside your target segment who do not yet use the category. And you can reduce churn, since keeping a customer is often the cheapest form of growth.
Lever | What it looks like | Typical tactics |
| Win share from rivals | Switching customers away from competitors | Sharper positioning, comparison messaging, targeted offers |
| Increase usage | Existing customers buy more or more often | Loyalty schemes, bundles, subscriptions, reminders |
| Convert non-users | Reaching target buyers who have not yet tried the category | Free trials, sampling, simpler onboarding, education |
| Improve retention | Fewer customers leave | Better service, renewal incentives, product quality fixes |
Market penetration tends to work best when the market is still growing, when your share is modest, or when scale lowers your unit costs. It is the quadrant most directly tied to day-to-day marketing strategy: pricing, promotion, distribution, and customer experience all act as penetration tools.
The benefits are speed and predictability. You already know the customer, the product, and the channel, so you can forecast with more confidence. The risks are a ceiling and a fight. Once most of the market is served, further gains come at the expense of rivals, who respond with price cuts or their own promotions. Discount-led market penetration can also train customers to wait for deals, eroding margin.
Three conditions improve the odds of success. First, measure share honestly, using a defined market rather than a flattering one. Second, understand why customers choose you or leave, not only how many do. Third, confirm that operations can handle extra volume without hurting service quality.
Product Development
Product development means introducing new or substantially improved products to your existing market. You keep the customers and create something fresh to offer them. A new feature set, a premium tier, a companion product, or a redesigned version of a flagship can all fit this quadrant.
The appeal is that you start with a relationship. Existing customers already know your brand and are cheaper to reach than strangers, so a well-judged product development strategy can lift revenue per customer and strengthen loyalty at the same time. It also helps defend against rivals who might otherwise tempt your customers with something newer.
The discipline is in choosing what to build. Strong product development begins with customer research rather than internal enthusiasm: what jobs are customers trying to do, where do current products fall short, and what would they pay for? Product development decisions also sit inside a wider set of product choices, which our overview of product strategy explains in more depth.
The costs are real. Development takes engineering time, design effort, testing, and launch support. A new product can cannibalise sales of an existing one, and a large launch can distract a team from keeping the core business healthy. There is also the question of product-market fit: a product that solves a problem your customers do not actually feel will fail even if it is well built.
Product development works best when the following conditions hold:
- You have direct access to customers and a clear view of their unmet needs.
- You have, or can acquire, the technical and design capability to build the product well.
- The new offering fits coherently within your wider product portfolio rather than fragmenting it.
- You can test cheaply before committing to full-scale development.
Treat this quadrant as a series of experiments. Prototypes, pilots, and limited releases reduce the cost of being wrong, and they generate evidence that is far more persuasive than a forecast.
Market Development
Market development means taking existing products to new markets. The product stays broadly the same, but the audience changes. That can mean a new geography, a new customer segment, a new sales channel, or a new use case that opens up a different set of buyers.
Route | Description | Example question to answer |
| New geography | Selling in another region or country | Do local regulations, languages, and prices allow our product to work as it is? |
| New customer segment | Targeting a different demographic or business type | Do these buyers have the same problem, and will they pay for our solution? |
| New channel | Reaching customers through a different route, such as online, retail, or partners | Does the channel reach buyers we cannot reach today, and at what margin? |
| New use case | Positioning the same product for a different purpose | Does the new purpose need changes in messaging, support, or packaging? |
In the Ansoff matrix, market development is attractive because the product is already proven. You are not asking whether the product works, only whether it works for these people. That is often a cheaper question to answer than building something from scratch.
But the “proven product” assumption can be misleading. Customers in a new market may have different needs, budgets, habits, and expectations. Regulations may require product changes, and local competitors may understand the audience better than you do. Many market entries stumble because a company assumes that what worked at home would transfer unchanged.
The practical safeguard is to validate demand before committing to scale. Interview prospects, run small pilots, test local pricing, and study how buyers currently solve the problem. Adaptation is normal and should be planned: language, packaging, payment methods, customer support hours, and legal compliance often need work. As a source of business growth strategies, market development rewards patience and local knowledge, and it blends closely with marketing strategy because new audiences usually need new messages and channels.
Diversification
Diversification means launching new products into new markets. It is the farthest step from the existing business because you must learn two unfamiliar things at once: what the product needs to be and who the customer is. A diversification strategy therefore carries the largest combined uncertainty in the matrix.
It is often divided into two types. Related diversification builds on existing capabilities, technologies, customers, or distribution, even though the product and market are new. Unrelated diversification moves into areas with little connection to the current business. The difference matters for risk and is explored in more detail in the next section.
Companies diversify for several reasons. A core market may be shrinking or saturated, making the current strategy unlikely to deliver growth. Spare capacity, data, or expertise may be put to use in a new setting. And spreading revenue across different businesses can reduce dependence on a single market, provided the new activities do not all rise and fall together.
As an illustration, Amazon’s move from online retail into cloud infrastructure services is often cited as diversification built on internal capability. Placing it in this quadrant is our interpretation, not an official classification, and the connection to existing know-how shows why “related” diversification is usually treated as less risky than a jump into an entirely unfamiliar field.
The risks are substantial. There are two learning curves, the investment is usually larger, results take longer, and management attention can be stretched thin. Overconfidence is a common failure: a company that is excellent in one field may assume that skill transfers when it does not. The sensible approach is to treat this quadrant as a portfolio of small, staged bets, use partnerships or acquisitions to borrow expertise, and set clear criteria for stopping. As a growth strategy, diversification can be powerful, but it is rarely the first thing to try.
Ansoff Matrix Diagram and Risk Levels
An Ansoff matrix diagram turns the framework into a single picture that a room full of people can point at. Most versions place products along one axis and markets along the other, with each axis running from “existing” to “new”. The four cells then hold the four strategies. Many diagrams add arrows or shading to show that uncertainty increases as you move away from the existing-product, existing-market corner. That visual cue is one of the main reasons the Ansoff matrix model has stayed popular: it communicates a strategic idea faster than a paragraph can.
Risk is the second thing the diagram is meant to convey. The table below summarises the general pattern. Treat it as a tendency, not a law. Actual risk depends on your capabilities, your competitors, the size of the investment, and the market itself, so a well-prepared market development move can be safer than a careless product launch.
Strategy | Product | Market | Typical uncertainty | Main reason |
| Market penetration | Existing | Existing | Lower | Product and customer are both known, so results are easier to forecast |
| Product development | New | Existing | Moderate | Customers are known, but product demand and delivery are unproven |
| Market development | Existing | New | Moderate | The product is proven, but customer behaviour in the new market is not |
| Diversification | New | New | Highest | Both the product and the market are unfamiliar at the same time |
The logic is easy to follow. Each step away from what you know adds a new variable, and diversification adds two. Notice also that product development and market development sit at similar levels. Which one is riskier for a given company depends on whether it is better at building things or at reaching new audiences.
Reading the Ansoff Matrix Diagram
This short Ansoff matrix explanation shows how to read the grid correctly:
- Check the axes first: Conventions vary. Some diagrams put products on the horizontal axis and markets on the vertical axis; others do the reverse. Confirm the labels before drawing any conclusions, and make sure the text of your document matches the picture.
- Start in the existing-existing cell: This is your current business. Every other cell is defined by how far it moves from here.
- Move one step at a time: Moving along one axis changes either the product or the market. Moving diagonally changes both, which is why diversification sits in the opposite corner.
- Read risk as distance: The further a cell is from your starting point, the more you will have to learn, and the more evidence you should demand before investing.
- Map real initiatives onto cells: A diagram is most useful when each initiative on your list is placed in a cell. If an idea refuses to fit neatly, that is a signal to define the product or market more precisely.
A useful variation is to size each initiative by its planned investment. A grid with one large bubble in the diversification corner and tiny ones elsewhere shows at a glance that a team’s growth plan is more aggressive than it may have intended. Because the product market grid is so simple, it also exposes lopsided portfolios of ideas very quickly: a plan with nothing in the penetration cell may be ignoring its cheapest source of growth.
Related vs Unrelated Diversification
Diversification is the quadrant where the simple risk ladder needs the most nuance, because not all new-product, new-market moves are equally unfamiliar. The split between related diversification and unrelated diversification captures that difference.
Factor | Related diversification | Unrelated diversification |
| Connection to current business | Shares technology, skills, customers, or distribution | Little or no overlap with the current business |
| What transfers | Know-how, brand credibility, supply chains, data | Mostly capital and general management |
| Learning required | Moderate: some of the new area is already understood | High: the company must learn an unfamiliar industry |
| Typical risk profile | Elevated but more manageable | Highest in the matrix |
| Main attraction | Synergies and cost advantages | Spreading earnings across different industries |
| Main danger | Assuming the overlap is larger than it really is | Overestimating general management skill |
Related diversification is not a free pass. Overlap on paper can disappear in practice: a firm may share a technology with the new business but not a sales approach, a customer type, or a regulatory environment. The test is whether the overlap reduces real uncertainty, such as lower development cost or faster customer acceptance, not whether a link can be described in a slide.
Unrelated diversification may suit organisations whose strength lies in capital allocation and management systems more than in any single industry. For most companies, though, it means starting almost from scratch. A sensible diversification strategy, whichever type it is, begins with a small test, borrows expertise through hiring or partnerships, and defines in advance what evidence would justify scaling up or walking away.
How to Use the Ansoff Matrix Step by Step
Using the Ansoff matrix well is less about filling in four boxes and more about running a disciplined conversation. Think of it as one of the lighter-weight strategic management tools: quick to apply, but only as good as the evidence you bring. The same process works for a startup choosing its next move and for a division of a large company preparing an annual plan. Used within strategic planning, it follows five stages:
- Establish your current product and market position.
- Identify customer needs, business objectives, and growth constraints.
- Generate at least one option in each quadrant.
- Evaluate each option against evidence, capability fit, investment, uncertainty, and expected value.
- Select priorities, define measurable outcomes, and translate the decision into initiatives.
The three subsections below cover these stages in practical terms. A point worth remembering throughout: the Ansoff matrix generates and organises growth options, but it does not validate demand or calculate returns. Pair it with customer research, competitive analysis, and financial modelling.

Analyze Current Products and Markets
Start with an honest inventory of what you sell and to whom. List every product or service, its revenue, its margin, and the customer groups that buy it. Then describe each market in terms you can measure: size, growth rate, your share, and the strength of competitors. This portrait of your product portfolio and customer base is the “existing” side of the matrix, and everything else is defined relative to it.
Ask questions that reveal where growth is genuinely constrained:
- Which customers buy the most, and which leave soonest?
- Where does our share look strong, and where is it low relative to the opportunity?
- Which products are mature, and which still have headroom?Mature products near the end of theproduct life cycleare often candidates for market development rather than more penetration.
- What jobs do customers hire us to do, and what jobs are they handing to someone else?
This step usually reveals how much market penetration is still available. Teams are often surprised to find that a segment they consider “served” is under-penetrated because of poor onboarding, patchy distribution, or a pricing gap. That finding changes the conversation: if the cheapest growth lever is unused, more ambitious quadrants must clear a higher bar.
If your business model is not documented clearly, a one-page canvas helps. The Business Model Canvas from Strategyzer lays out customer segments, value propositions, channels, and revenue streams, and gives you a concrete reference for what counts as an existing product or market. Combine it with your current marketing strategy review so that channels, messaging, and customer segments are described consistently.
Score Options by Risk and Fit
With the baseline in place, brainstorm options in all four quadrants. Aim for several in each, including ideas that feel unlikely. Then evaluate them on the same criteria, so that a charismatic pitch does not outrank a stronger but quieter idea. A simple weighted scorecard is enough. Weights should reflect your strategy, so adjust them. The example below is illustrative.
Criterion | Weight | What a high score means |
| Customer evidence | 25% | Research or sales data show real demand |
| Capability fit | 20% | We already have the skills, technology, and relationships needed |
| Strategic fit | 15% | It supports the company’s goals and competitive position |
| Investment required | 15% | Cost and time are modest relative to the potential gain |
| Time to results | 10% | Early signals will appear within a quarter or two |
| Competitive intensity | 10% | Rivals are weak, slow, or absent in this space |
| Reversibility | 5% | We can stop or adjust without lasting damage |
Score each option from one to five on each criterion, multiply by the weight, and total the results. Do not treat the final number as an oracle. Its value lies in exposing disagreements: if two people score the same option very differently on customer evidence, that gap tells you what to research next.
Consider how each score affects your wider growth strategy. A high-risk diversification strategy might still deserve a small test budget if its potential upside is large and its downside is capped. A safe penetration push might deserve less than you think if it merely cannibalises revenue you would have won anyway. Look too at your competitive strategy: ask how rivals are likely to respond, because an option that looks attractive in isolation may trigger a price war.
Also decide how you will know whether an option is working. Objectives describe the outcome you want, and indicators show whether you are getting it. If you are unsure how the two differ, our comparison of OKR vs KPI explains how to pair ambitious objectives with measurable results.
Turn Choices Into Roadmap Themes
A strategy that stays on a slide changes nothing. The final step is to translate the chosen options into themes that a delivery team can plan around. A theme is a strategic outcome, not a feature list: for example,Seeoutcome vs outputfor why the difference matters. “deepen usage among existing customers” or “prove demand in a new regional market”. Each theme should link back to one Ansoff quadrant, so the reasoning behind it stays visible.
If you are new to this planning format, the guide on what is a product roadmap explains how themes, outcomes, and timelines fit together. In practice, an Ansoff-informed roadmap usually has these characteristics:
- A core theme from market penetration that protects and grows the base business.
- One or two bets from product development strategy or market development, each with a clear hypothesis to test.
- A small exploratory slot for diversification, if the company can afford it, with explicit stop criteria.
- Measurable outcomes attached to each theme, such as retention rate, conversion, or revenue from a new segment.
- A review date at which evidence decides whether to continue, change, or stop.
Define who owns each theme, what resources it receives, and what must be true for it to succeed. Then schedule reviews. Markets move, competitors respond, and early results change the picture. A good set of business growth strategies is revisited at least every quarter, and the Ansoff grid is a handy way to show how the portfolio of bets has shifted.
Ansoff Matrix Examples
The best way to understand the framework is to see it applied. This section presents two Ansoff matrix example scenarios, one from streaming and one from consumer goods, followed by a template you can adapt. Some examples draw on publicly reported decisions by real companies. In those cases, the company’s action is the verified part, and the quadrant is our interpretation, since companies rarely describe their moves in Ansoff terms. Other examples are hypothetical and labelled as illustrative. Together they show how the Ansoff matrix connects abstract categories to concrete business growth strategies.
Ansoff Matrix Example From Streaming
Netflix offers a useful case because its history spans several quadrants. It began as a DVD-by-mail service and launched streaming in the United States in 2007. In 2016, it expanded its service to more than 190 countries. In late 2022, it introduced a lower-priced plan supported by advertising, and in 2023 it began charging for password sharing outside a household. It has also added games and live events to its catalogue. The table separates what happened from how we classify it.
Quadrant | Action | Basis |
| Market penetration | Introduce an ad-supported plan and enforce paid sharing to convert price-sensitive viewers and extra users | Publicly reported moves; classification is our interpretation, and some would also describe the ad plan as a pricing or packaging innovation |
| Product development | Add games and live programming for existing subscribers | Publicly reported moves; classification is our interpretation |
| Market development | Expand the streaming service to many new countries | Publicly reported; commonly cited as market development |
| Diversification strategy | Enter physical venues or consumer retail, a new offering for a new customer relationship | Hypothetical and illustrative only |
The lesson is not that a company should copy this sequence. It is that growth strategies often combine quadrants and shift over time. Market penetration brings the lowest uncertainty and can lift revenue per subscriber without a new product. Market development depends on content rights, local pricing, payment methods, and regulation. The hypothetical diversification example would require retail operations, logistics, and a different relationship with customers, which is why any serious company would test it in small steps first.
Ansoff Matrix Example From Consumer Goods
Consumer goods firms use the grid constantly, because they sell familiar products through many channels and are always weighing new variants, new regions, and new categories. The scenario below is hypothetical: a fictional toothpaste brand, BrightSmile, with a strong position in one country’s supermarkets.
Quadrant | Hypothetical action | Key risk to test |
| Market penetration | Run multi-pack promotions, improve shelf placement, and launch a refill subscription to raise repeat purchases | Discounting that erodes margin without lifting loyalty |
| Product development | Launch a whitening range and a sensitive-teeth formula for current shoppers | New variants that only cannibalise the flagship |
| Market development | Sell the existing range through pharmacies and online marketplaces, then enter a neighbouring country | Different pricing, regulation, and retailer expectations |
| Diversification | Introduce a premium electric toothbrush line aimed at a younger, tech-focused audience | Entirely new manufacturing, supply chain, and competitors |
For a real-world flavour, brands such as Dove have grown from a single soap-style product into wider personal-care ranges and many national markets. Treat this as an illustration of how a consumer brand can combine product development and market development over time; whether any single move was intended as a particular Ansoff quadrant is our interpretation, not a company statement.
The BrightSmile table also shows how a product development strategy and a market penetration push can reinforce each other. A new whitening range gives sales teams a reason to revisit retailers, which helps penetration. Equally, a market development move into pharmacies may reveal unmet needs that suggest the next product. Seeing the connections is one of the main benefits of working through all four cells rather than just choosing one.
Sample Strategy Table
The table below is a reusable Ansoff matrix template. Replace the illustrative actions with your own initiatives and add a lead metric that tells you early whether each one is working. This is where the Ansoff matrix model turns from theory into a working growth strategy document.
Strategy | Product | Market | Illustrative action | Lead metric |
| Market penetration | Existing | Existing | Increase repeat purchases | Repeat purchase rate |
| Product development | New | Existing | Launch a new product line | Adoption among current customers |
| Market development | Existing | New | Enter a new geographic market | Qualified leads and early conversion in the new market |
| Diversification | New | New | Enter a new category and customer market | Pilot revenue against stage-gate targets |
To use it, write one to three initiatives per row, assign an owner, and attach a date for the first evidence review. If a row is empty, ask whether that is a deliberate choice or an oversight. An empty penetration row, for example, is often a sign that the team has jumped to more exciting options before testing the cheaper ones.
Ansoff Matrix vs BCG Matrix vs SWOT: Comparison Table
The Ansoff matrix is one of several strategic management tools, and it is easy to mix them up because they all use simple visuals. They answer different questions, so choosing the right one depends on what you are trying to decide. The table below compares four of the most common.
Tool | Core question | Main inputs | Typical output | Best used when |
| Ansoff matrix | Which direction should we grow in? | Current products, current markets, ideas for new ones | Growth options grouped into four quadrants | Generating and organising growth options |
| BCG matrix | Where should we invest, hold, or withdraw? | Market growth rate and relative market share for each product or unit | Portfolio categories: stars, cash cows, question marks, dogs | Reviewing a multi-product portfolio |
| SWOT analysis | What internal and external factors shape our position? | Strengths, weaknesses, opportunities, threats | A structured list of factors | Starting a planning cycle or framing a decision |
| Porter’s Five Forces | How intense is competition in this industry? | Rivalry, entrants, substitutes, supplier power, buyer power | An assessment of industry attractiveness | Judging whether a market is worth entering or defending |
Two distinctions are worth stressing. First, the BCG matrix, which is the same thing as the growth-share matrix, looks inward at the products you already have, whereas the Ansoff matrix looks outward at where you might go. Second, SWOT and Porter’s Five Forces are diagnostic: they describe the situation but do not generate a list of strategic moves on their own.
These tools work best in sequence rather than in competition. A business might use SWOT and Five Forces to understand its environment, then the Ansoff matrix to identify growth directions, and finally the BCG matrix to decide how the resulting portfolio should be funded. Five Forces is especially valuable before a market development or diversification move, since it tests whether the new industry is structurally attractive. In strategic planning, the frameworks add up to a fuller picture than any one of them alone, and none of them replaces judgement about your own customers and capabilities.
Limitations of the Ansoff Matrix
The Ansoff matrix is popular because it is simple, and its limitations follow from the same simplicity. Knowing them keeps the tool useful rather than misleading. It:
- Simplifies reality: Real markets have many segments, and real products sit on a spectrum between old and new. The two-by-two grid forces a binary choice that can hide important differences.
- Cannot quantify risk by itself: The risk ranking is a general tendency. The framework does not measure investment, probability, or expected return, so it cannot tell you which option is the best bet.
- Overlooks competitors and external constraints: The grid does not show how rivals will react, what regulation applies, or how technology may change the landscape. Any competitive strategy has to be built with other tools.
- Depends on uncertain forecasts: Demand for a new product or market is hard to predict, and the framework offers no method for doing it.
- Ignores timing and resources: A sound option can still fail if the company lacks the cash, people, or time to execute it.
- Is static: The grid shows a moment in time, yet a business is constantly moving between cells.
For these reasons, use the Ansoff matrix as a starting point in strategic planning. Pair it with customer research, financial modelling, and the analysis tools described above before committing real resources.
Common Pitfalls
Most failures come from how the framework is used rather than from the framework itself. Watch for these patterns:
- Choosing a quadrant before researching customers: Starting from a favourite idea and fitting evidence to it is a common error. Work out the customer need first, then see which quadrant it points to.
- Assuming a new market will behave like the old one: Different customers have different priorities, price sensitivity, and buying habits. Treat every market development plan as a set of hypotheses.
- Underestimating execution cost: Launching a product or entering a region usually requires more time, people, and money than the first plan allows. Include support, compliance, and marketing costs in the estimate.
- Treating diversification as an automatic path to growth: A diversification strategy can spread risk, but it can also spread management attention too thinly. It needs a clear rationale, a capped budget, and stop criteria.
- Neglecting the core: A flashy new initiative can starve the existing business of attention. A weak marketing strategy in the core market is often cheaper to fix than a new venture is to build.
- Setting and forgetting: A growth strategy chosen once and never reviewed will drift out of date as conditions change.
The common thread is discipline. Each pitfall is avoided by separating assumptions from evidence, assigning owners, and reviewing results at fixed intervals.
How Product Owners Use the Ansoff Matrix?
The Ansoff matrix is usually described as a marketing or corporate tool, but it fits the daily concerns of product people well. Product owners and product managers decide what to build for whom, and that is exactly what the two axes capture. The framework helps them structure growth conversations with executives, sales, and engineering without turning every discussion into an argument about features.
Here is how it typically plays out:
- Framing the roadmap: Product teams can sort backlog themes by quadrant. Improvements to onboarding and retention point to market penetration; new features and tiers point to product development strategy; localisation or new segment work points to market development; and unfamiliar bets point to diversification. The result is a roadmap whose strategic logic is visible.
- Balancing the product portfolio: If every initiative sits in one cell, the team may be taking too much or too little risk. The grid makes the balance of the product portfolio easy to discuss.
- Linking growth ideas to discovery: Each quadrant contains assumptions about customers.Product discovery is how a team tests them through interviews, prototypes, and experiments before committing to full delivery.
- Connecting vision and strategy: The matrix helps turn a long-term aspiration into specific choices. If you are unsure how the two relate, read product vision vs product strategy, and see the SVPG product strategy overview for a practitioner’s view on how strategy connects to product work.
- Prioritising without replacing prioritisation methods: The Ansoff grid shows where to look for growth. Methods such as avalue vs effort matrixdecide which items within a quadrant come first.
It also clarifies roles in growth discussions.Who is a product manager explains the broader responsibilities of the role, while product owner vs product manager outlines how the two positions differ in many organisations. In practice, the person who owns the backlog is often the one translating a chosen quadrant into stories and priorities, while the person responsible for product strategy shapes which quadrants deserve attention.
A useful habit is to bring a one-page Ansoff grid to quarterly planning. Place each current initiative in a cell, mark its evidence level as strong, partial, or assumed, and ask which cells deserve more or less investment. This keeps strategic planning grounded in the product work rather than separate from it. It also helps product people contribute to marketing strategy and growth strategy discussions, because they can state the product assumptions behind each option clearly.
Product people who want to build these skills can look at structured training. Our CSPO certification training covers the product owner role in Scrum teams, and the A-CSPO certification training offers a more advanced path for those with experience. If you are still weighing the career itself,is product management a good career, look at the trade-offs.
Conclusion
The Ansoff matrix gives leaders a simple but powerful way to think about growth. By crossing existing and new products with existing and new markets, it produces four options: market penetration, product development, market development, and diversification. Each carries a different level of uncertainty, and each calls for different capabilities, which is why a thoughtful growth strategy rarely relies on only one.
The most important practical lessons are straightforward. Begin with a clear picture of your current products and markets. Generate options in every quadrant rather than defaulting to the exciting ones. Score them on evidence, fit, investment, and reversibility. Then convert the winners into roadmap themes with measurable outcomes and review dates. The framework also works best alongside other tools, including SWOT, Five Forces, and portfolio analysis, because each answers a question the others leave open.
Finally, remember what the matrix cannot do. It organises business growth strategies but does not prove that customers want them. Treat each choice as a hypothesis, test it with real market evidence, and judge whether the organisation can execute. Used that way, the Ansoff matrix supports better strategic planning and clearer conversations, which is exactly what a decision under uncertainty needs.









 Lowest-Price Challenge












 Personalized Path



.webp)


 USA
 Canada
 India
 UK
 Australia
 Singapore


