


 Call Us




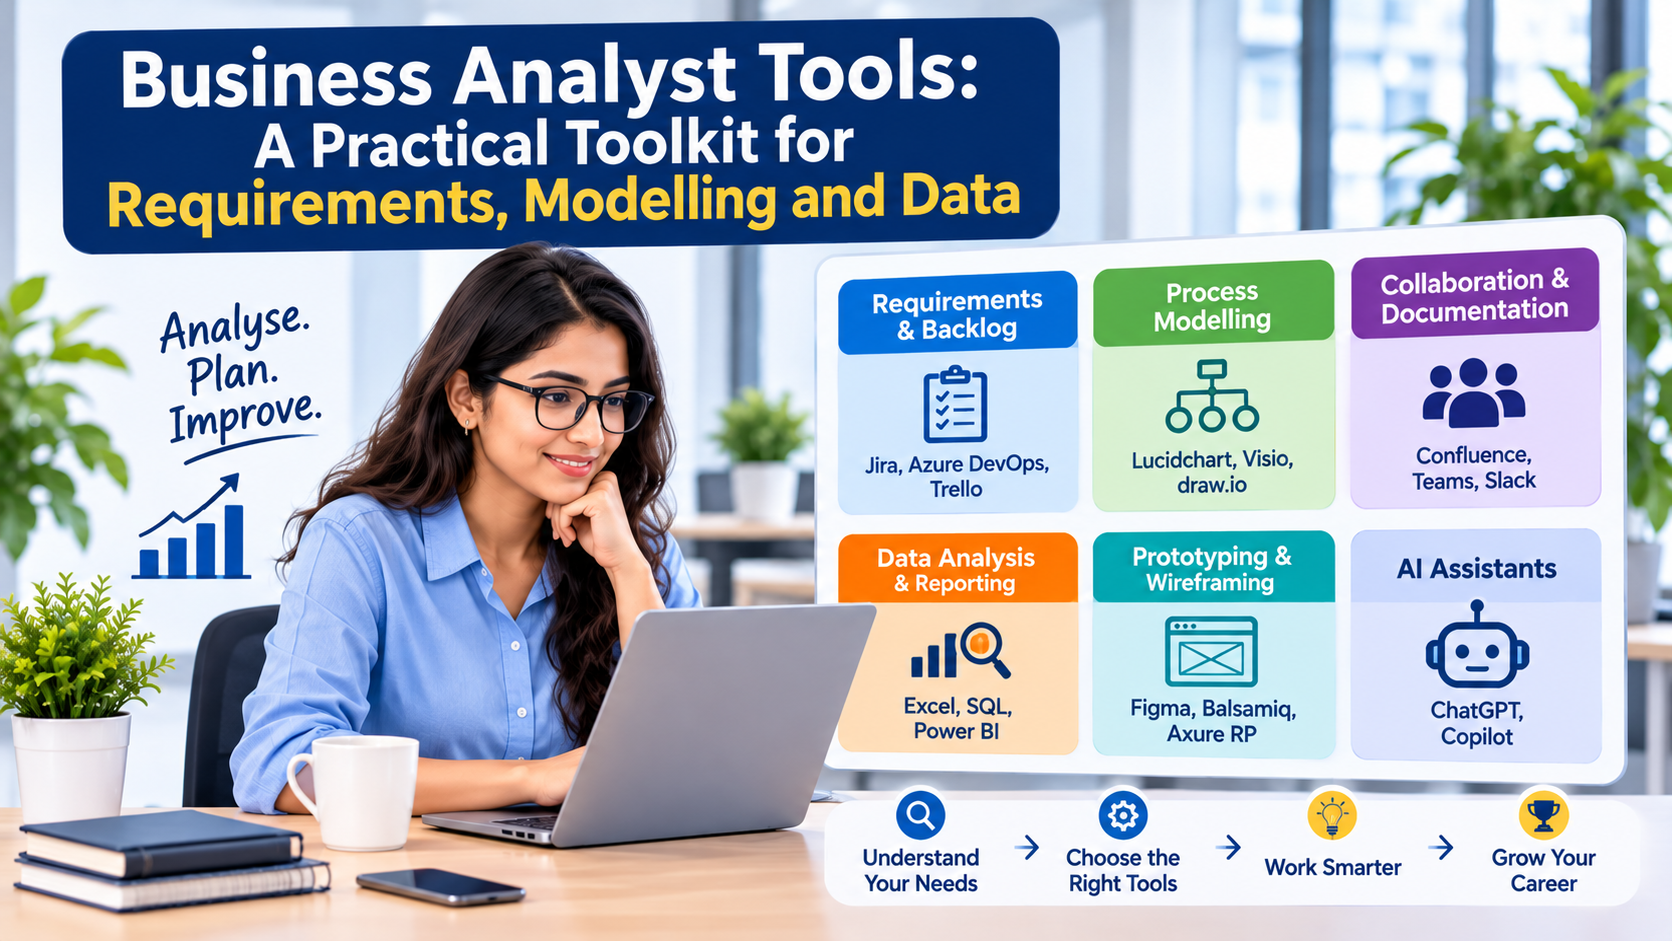
Business analyst tools are software applications that help analysts gather requirements, model processes, manage backlogs, analyse data, collaborate with stakeholders, and validate solutions. Common tools include Jira, Azure DevOps, Trello, and Jama Connect for requirements management; Lucidchart, Visio, draw.io, and Bizagi Modeller for process modelling; and Confluence, Microsoft Teams, Slack, and Miro for collaboration and documentation. Analysts also use Excel, SQL, Power BI, and Tableau for data analysis, while Figma, Balsamiq, and Axure RP support wireframing and prototyping. AI assistants can further simplify meeting summaries, documentation, and feedback analysis.
The right toolkit depends on project complexity, team size, budget, methodology, integrations, and security requirements. For example, Agile teams may prefer Jira and Confluence, while Microsoft-based organisations may use Azure DevOps, Teams, and Power BI. Beginners should start with Excel and documentation, then learn backlog management, process mapping, SQL, reporting, and prototyping. Free tools can be sufficient for learning and smaller projects, whereas complex or regulated projects may require specialised platforms with formal traceability. Ultimately, business analysts should focus on mastering a small set of well-integrated tools rather than learning every available application.
Key Highlights
- Business analyst tools fall into five core categories: requirements and backlog, process modelling, collaboration and documentation, data analysis and reporting, and prototyping.
- No analyst needs every tool. Most BAs build a core set of three to five tools around their methodology and employer.
- Jira, Confluence, Excel, SQL, Lucidchart and Figma appear most often in the BA tools list below.
- Choose tools by task first, then by budget, integrations, security, and learning curve.
- Beginners should start with documentation and spreadsheets before moving to specialised software.
- AI assistants can speed up summaries and first drafts, but every output needs human validation.
Introduction
A business analyst rarely works in one application. On a single project, an analyst might interview stakeholders in the morning, sketch a process map at lunch, write user stories in the afternoon, and check a dataset before the end of the day. Each activity needs something different, which is why business analyst tools span several categories rather than one product.
This guide is a practical toolkit, not a catalogue of software names. You will see what each tool does, how business analysts use it in real work, where it falls short, and when it is worth adopting. It also works as a BA tools list you can scan quickly: the table below summarises every tool covered, and the sections that follow explain each one in detail.
Business analysts work across stakeholders, processes and technology teams to understand business needs and translate them into practical solutions. Understanding what a business analyst does provides useful context for why different tools are required throughout the role. If you already know the role, skip ahead to the tool categories. If you are new, that context will make the software choices easier to judge.
The tools used by business analysts also change with the project. An Agile product team may live in Jira and Confluence, while a regulated finance programme may depend on Visio diagrams, Excel models and formal traceability. Neither approach is wrong. The aim is to match the tool to the work.
Here is the full list of business analyst tools covered in this article.
Tool | Category | Primary purpose | Typical BA task |
| Jira | Requirements and backlog | Track user stories, issues and sprints | Backlog refinement, prioritisation |
| Azure DevOps | Requirements and backlog | Manage work items, boards and delivery pipelines | Requirements tracking in Microsoft environments |
| Trello | Requirements and backlog | Visual Kanban boards | Lightweight task and backlog tracking |
| Jama Connect | Requirements and backlog | Requirements management and traceability | Regulated or complex projects |
| Lucidchart | Process modelling | Browser-based diagrams and flowcharts | Process maps, BPMN-style diagrams |
| Microsoft Visio | Process modelling | Structured business and technical diagrams | Formal process documentation |
| draw.io (diagrams.net) | Process modelling | Free diagramming | Quick flowcharts and workflow sketches |
| Bizagi Modeler | Process modelling | BPMN process modelling | Detailed as-is and to-be models |
| Confluence | Collaboration and documentation | Shared documentation and knowledge base | Requirements documents, decision logs |
| Microsoft Teams | Collaboration and documentation | Chat, meetings and file sharing | Stakeholder communication |
| Slack | Collaboration and documentation | Channel-based team messaging | Day-to-day team coordination |
| Miro | Collaboration and documentation | Online whiteboard | Workshops, brainstorming, journey maps |
| Excel | Data analysis and reporting | Spreadsheets, formulas, pivot tables | Data cleaning, quick analysis |
| SQL | Data analysis and reporting | Querying relational databases | Pulling and validating data |
| Power BI | Data analysis and reporting | Dashboards and reports | Business reporting |
| Tableau | Data analysis and reporting | Interactive data visualisation | Insight presentation |
| Figma | Prototyping and wireframing | Design and interactive prototypes | Validating requirements visually |
| Balsamiq | Prototyping and wireframing | Low-fidelity wireframes | Early screen concepts |
| Axure RP | Prototyping and wireframing | Detailed, logic-driven prototypes | Complex interaction requirements |
| AI assistants | Cross-category | Summarising, drafting, theme-finding | Meeting notes, first-draft documentation |
Why Tool Choice Matters for Business Analysts?
A business analyst's output is only useful if other people can read it, trust it and act on it. The software you pick shapes all three. Good business analyst software makes requirements visible, keeps versions under control, and lets stakeholders respond without a long meeting. Poor choices create scattered documents, conflicting versions, and lost decisions.
Choosing the right software becomes easier when analysts understand the activities they need to perform, from stakeholder engagement to requirements validation. These activities are part of established business analysis practices, and each one tends to favour a particular type of tool. Interviews and workshops suit whiteboards and documents. Modelling suits diagramming software. Prioritisation suits backlog tools. Analysis suits spreadsheets and databases.
Several factors make tool choice more than a personal preference.
Project complexity: A small internal improvement may need only a shared document and a Kanban board. A multi-year regulatory programme may need formal traceability so every requirement links to a design element, a test and a business objective.
Collaboration: Business analysts sit between business and technical teams. A tool that only the analyst can open does little to reduce misunderstanding. Tools with comments, version history, and easy sharing help developers, testers, and sponsors review the same source of truth.
Efficiency and accuracy: Manual copying of requirements between documents introduces errors. Integrated tools reduce that risk, for example, when a Confluence page links directly to Jira tickets, so a change in one place is visible in the other.
Stakeholder needs: Executives want a dashboard, developers want clear acceptance criteria and operations teams want a process diagram. A capable analyst chooses the format that suits each audience, and the tool follows from that.
There is also a career angle. Employers often list specific business analyst tools in job descriptions, and familiarity with them shortens onboarding. That does not mean you must master a long list. It means understanding the purpose of each category so you can pick up a new product quickly.
Requirements and Backlog Tools
Requirements and backlog tools are where business needs become traceable, prioritised work items. They are the centre of most business analyst software stacks because requirements are the analyst's core deliverable.
What these tools do
They capture requirements in a structured form, such as epics, user stories, acceptance criteria andnon-functional requirements. They let teams rank work by value, effort or risk, track status through a workflow and, in more advanced products, showrequirements traceability: the link from a business need to the solution element and test that satisfies it.

In Agile projects, requirements evolve as teams receive feedback and refine priorities. An agile business analyst needs tools that make these changes visible and manageable, so the backlog stays a living, ordered list rather than a stale document. Atlassian's backlog management guidance is a useful vendor-neutral starting point for what to look for in this category.
Jira
Jira is the tool most business analysts meet first on Agile teams. It organises work as epics, stories, tasks and bugs, supports Scrum and Kanban boards, and offers filters, dashboards and workflow customisation. A BA typically writes and refinesuser stories in Jira, attachesacceptance criteria, links related issues and keeps priorities current before sprint planning.
Its strengths are flexibility, a large ecosystem of integrations and wide adoption. Its limitation is that a heavily customised Jira instance can become complicated, and it is not a full requirements management system with formal traceability matrices unless extended with add-ons.
Jira can help teams organise user stories, track issues and manage backlogs. Business analysts who want practical familiarity with the platform can explore Jira Software training.
Azure DevOps
Azure DevOps combines work item tracking, boards, repositories and pipelines. It suits organisations already using Microsoft technology, where requirements, code and builds sit in one place. A BA can manage features and stories on boards and link them to development work and test cases. The trade-off is that it feels more developer-oriented than some analyst-friendly alternatives.
Trello
Trello offers simpleKanban boardswith cards, lists, and checklists. It works well for small teams, early-stage products, or analysts tracking their own tasks. It lacks the depth for formal traceability or complex workflows, so teams often outgrow it as projects scale.
Jama Connect
Jama Connect is a dedicated requirements management platform used where traceability, impact analysis, and review workflows matter, such as regulated or safety-critical projects. It gives a BA structured requirement hierarchies and clear trace links. It carries more setup and cost than general task trackers, so it is rarely the right choice for a small Agile team.
Comparing requirements and backlog tools
Tool | Key capabilities | BA use case | Suitable project or team |
| Jira | Epics, stories, boards, workflows, filters | Write and prioritise user stories | Agile teams of most sizes |
| Azure DevOps | Work items, boards, test plans, pipelines | Link requirements to development and testing | Microsoft-centred organisations |
| Trello | Kanban cards, lists, checklists | Track small backlogs and tasks | Small teams, simple projects |
| Jama Connect | Requirement hierarchies, trace links, reviews | Demonstrate traceability and manage change | Regulated or complex programmes |
When should a BA use them?
Use a backlog tool as soon as more than one person needs to see and act on your requirements. Choose a lightweight option for simple projects, an integrated Agile tool for product teams, and a dedicated requirements platform when auditors, regulators or contracts demand formal traceability.
Process Modelling and Diagramming Tools
Many business problems are process problems. Process modelling and diagramming tools help analysts draw how work happens today, where it breaks down and how it should work after a change.
What these tools do
Process mapping is the practice of visualising the steps, decisions, roles and handoffs in a workflow. Common diagram types include flowcharts,swimlane diagrams,value stream mapsand BPMN (Business Process Model and Notation) diagrams. IBM's explanation of process modelling gives a clear overview of why organisations model processes and what the models are used for.
For a BA, a good process diagram does three things. It exposes inefficiencies and gaps, it gives stakeholders a shared picture to correct, and it becomes a reference that developers and testers can use. A typical use case is documenting an as-is order approval process, spotting two redundant approvals, and then drawing a to-be version that removes them.

Lucidchart
Lucidchart is a browser-based diagramming tool with templates for flowcharts, swimlanes, BPMN-style diagrams, and org charts. Real-time collaboration and commenting make it easy to review a diagram with remote stakeholders. It suits teams that value ease of use and sharing. Advanced features and larger team use typically require paid plans, so check current pricing and limits.
Microsoft Visio
Visio is a long-established tool for structured business and technical diagrams, with extensive stencils and strong integration with Microsoft 365. Organisations with formal documentation standards often prefer it. It is less lightweight than browser-based tools, and licensing can be a barrier for freelancers or small teams.
draw.io (diagrams.net)
draw.io is a free diagramming tool that works in the browser and integrates with common storage and documentation platforms. It handles flowcharts, swimlanes, and basic BPMN shapes well. It is an excellent starting point for beginners and budget-conscious teams, though it offers fewer enterprise governance features than commercial products.
Bizagi Modeler
Bizagi Modeler focuses on BPMN. It suits analysts who need rigorous as-is and to-be models, documentation and, in some set-ups, simulation. It is more specialised than general diagram tools, so it makes most sense when process modelling is a central part of your role.
Comparing process modelling tools
Tool | Diagram types | Key features | Best suited for |
| Lucidchart | Flowcharts, swimlanes, BPMN-style, org charts | Templates, real-time collaboration, comments | Remote and cross-functional teams |
| Microsoft Visio | Flowcharts, BPMN, technical diagrams | Large stencil library, Microsoft 365 fit | Formal documentation in Microsoft shops |
| draw.io | Flowcharts, swimlanes, basic BPMN | Free, simple, flexible storage | Beginners and small budgets |
| Bizagi Modeler | BPMN process models | Detailed notation, documentation support | Process-heavy transformation work |
When should a BA use them?
Reach for a diagramming tool whenever a process has more than a handful of steps, multiple roles, or decision points. Start simple. A clear swimlane in a free tool is more valuable than a perfect BPMN model nobody reads. Move to specialised BPMN software when the project demands notation standards, process simulation, or formal governance.
Collaboration and Documentation Tools
Business analysis is a communication job. Collaboration and documentation tools hold the conversations, decisions, and reference material that keep a project aligned.
What these tools do
They provide shared spaces for requirements documents, meeting notes, decision logs, and glossaries. They enable messaging, video meetings, and workshops. Most also provide version history and search, which supports version control and audit trails.
Confluence
Confluence is a wiki-style workspace where BAs publish requirements documents, user guides, meeting notes and decision records. Templates and page hierarchies keep content organised, and its tight link to Jira lets stories reference the pages that explain them. The limitation is that unstructured wikis can sprawl without clear naming and ownership.
Microsoft Teams and Slack
Microsoft Teams combines chat, meetings, and file sharing, and fits naturally in Microsoft 365 organisations. Slack offers channel-based messaging with a large app ecosystem. A BA uses these for quick clarifications, stakeholder updates, and meeting follow-ups. Neither is a good place to store final requirements, because important decisions get buried in message history. Capture outcomes in a document or backlog tool.
Miro
Miro is an online whiteboard for workshops, brainstorming, journey maps, affinity grouping and stakeholder mapping. It recreates the sticky-note workshop for remote teams. Boards can become cluttered, so export or summarise key outcomes into your formal documentation.
Where AI fits in
AI can also support activities such as summarising meeting notes, organising information and preparing initial documentation. Business analysts interested in exploring these applications can learn more through generative AI for business analysts. Many collaboration platforms now include built-in AI features, and standalone assistants can also help. Whichever you use, never paste confidential client data into a tool your organisation has not approved, and always check generated content against the source material.
Comparing collaboration and documentation tools
Tool | Collaboration features | Documentation use | Limitation |
| Confluence | Comments, page sharing, Jira links | Requirements, decision logs, how-to pages | Can become disorganised without structure |
| Microsoft Teams | Chat, meetings, shared files | Meeting records and file access | Decisions can get lost in chat |
| Slack | Channels, threads, integrations | Quick updates and links | Not designed for formal documentation |
| Miro | Live boards, sticky notes, voting | Workshop outputs and journey maps | Needs summarising into formal documents |
When should a BA use them?
Use a documentation platform as the single source of truth, a messaging tool for fast conversation, and a whiteboard for workshops. Agree up front where each type of information lives, so stakeholders always know where to look.
Data Analysis and Reporting Tools
Business analysts increasingly back recommendations with evidence. Data analysis and reporting tools help them find patterns, test assumptions, and present results clearly.
What these tools do
They let analysts clean and combine data, calculate metrics, query databases, build dashboards, and communicate findings through data visualisation. The mix ranges from familiar spreadsheets to full business intelligence platforms.
Excel
Excel remains the most widely used data tool in business analysis. Formulas, pivot tables, charts, and lookup functions cover a large share of everyday needs, from reconciling two lists to modelling a business case. Microsoft's Excel documentation is the authoritative reference for current features. Excel's limits appear with very large datasets, complex data pipelines and shared reporting, where errors can slip in unnoticed.
SQL
SQL is not a product but a language for querying relational databases, and it is supported by many tools such as database clients and BI platforms. With basic SQL, a BA can pull data directly, check record counts, validate that a new system behaves as specified, and answer stakeholder questions without waiting for a developer. You do not need advanced engineering skills. Selecting, filtering, joining, and aggregating data cover most BA needs.
Power BI
Power BI builds interactive reports and dashboards from many data sources and fits well with Microsoft environments. A BA might use it to define the metrics a dashboard should show, then validate that the numbers match business expectations. The learning curve rises with data modelling and DAX formulas.
Tableau
Tableau focuses on interactive visual analysis and strong dashboards. Tableau describes its capabilities on itsdata analysis software page, which is worth reading when evaluating what visual analytics platforms can do. It is powerful for exploring and presenting data, though licensing and skills can be a barrier for small teams.
Comparing data analysis and reporting tools
Tool | Main function | BA application | Skill level |
| Excel | Spreadsheets, pivot tables, charts | Clean data, build quick models and business cases | Beginner to intermediate |
| SQL | Query relational databases | Extract and validate data, answer ad hoc questions | Beginner to intermediate |
| Power BI | Dashboards and reporting | Define and validate business metrics | Intermediate |
| Tableau | Interactive visualisation | Explore trends and present insights | Intermediate |
When should a BA use them?
Start with Excel for almost any numeric task. Add SQL when the data lives in databases and spreadsheets stop being enough. Adopt Power BI or Tableau when stakeholders need recurring, shareable dashboards rather than one-off analysis.
Prototyping and Wireframing Tools
Requirements written as text can be read in several different ways. Prototyping and wireframing tools let stakeholders see and click through a proposed solution before anyone builds it, which makes misunderstandings visible early.
What these tools do
A wireframe is a simple layout of a screen that shows structure and content without visual polish. A prototype adds interaction, so users can click through a flow. Figma's wireframing guide explains the purpose of wireframes clearly and is a helpful reference for analysts new to the idea.
Business analysts rarely replace designers. Instead, they use these tools to validate requirements. A BA might sketch a three-screen onboarding flow, walk a stakeholder through it, and discover a missing approval step in ten minutes, something a written specification might not have revealed until testing.
Figma
Figma is a collaborative design tool used for wireframes, mockups, and clickable prototypes. Multiple people can comment on the same file, which suits review cycles. It offers a free tier, though paid plans add features, so check current options. Analysts may find the full design feature set more than they need, but basic wireframing is quick to learn.
Balsamiq
Balsamiq produces deliberately rough, sketch-style wireframes. The low-fidelity look keeps feedback focused on structure and flow instead of colours and fonts. It is fast and approachable for early concept work, but less suited to polished or highly interactive prototypes.
Axure RP
Axure RP supports detailed prototypes with conditional logic, dynamic content, and documentation features. It suits complex interaction requirements, such as multi-step forms with validation rules. The cost is a steeper learning curve.
When should a BA use them?
Use wireframes when requirements involve screens, forms or user journeys, and when stakeholders struggle to react to written descriptions. Begin with low fidelity. Move to interactive prototypes only when the flow is stable enough to justify the effort.
Business Analyst Toolkit by Task
The previous sections described tools by category. This section flips the view: start from what you need to accomplish and find the matching tool type. It is also the quickest way to build the best business analyst tools shortlist for your own situation.
Task | Tool type | Example features | When needed |
| Elicit requirements | Whiteboards, documents, survey and meeting tools | Sticky notes, shared notes, recordings, templates, comments | Discovery phase, workshops, stakeholder interviews |
| Model processes | Diagramming and BPMN tools | Swimlanes, decision shapes, templates, export to documents | Mapping current and future workflows |
| Track backlog | Backlog and work item trackers | Epics, stories, priorities, workflows, sprint boards | Ongoing delivery, sprint planning, refinement |
| Analyse data | Spreadsheets, SQL clients, BI tools | Pivot tables, queries, joins, dashboards, charts | Building a business case, validating assumptions, reporting |
| Document and share knowledge | Wiki and documentation platforms | Templates, version history, permissions, search | Requirements sign-off, decision records, handover |
| Validate with users | Wireframing and prototyping tools | Clickable screens, comments, shareable links | Before development, during design reviews |
Elicit requirements
Elicitationrelies on conversation more than software. Tools help capture and organise what you hear. A shared document with agreed headings, a whiteboard for group exercises and a meeting recording (with permission) are usually enough. The mistake to avoid is jumping straight to a requirements tool before you understand the problem.
Model processes
Once you understand how work flows, draw it. Choose the simplest diagram that communicates clearly, and keep one notation across the project so readers do not have to relearn symbols.
Track backlog
Backlog tools turn agreed requirements into ordered work. The key habits are consistent story formats, visible priorities, and regular refinement. The software should support those habits, not replace them.
Analyse data
Data tools answer questions such as how often a problem occurs, what it costs, and whether a solution worked. Start with a clear question, then choose the lightest tool that can answer it.
A sample toolkit by situation
The combinations below are illustrative, not prescriptive.
- Agile product team: Jira for the backlog, Confluence for documentation, Miro for workshops, Figma for wireframes, Excel or SQL for ad hoc analysis.
- Microsoft-centred enterprise: Azure DevOps for work items, Teams and SharePoint for collaboration, Visio for diagrams, Excel and Power BI for analysis.
- Small business or freelancer: Trello for tracking, draw.io for diagrams, Google or Microsoft documents for requirements, Excel for analysis.
- Regulated project: A requirements management platform for traceability, Visio or Bizagi for formal process models, controlled documentation and audited reporting.
How to Choose Tools for Your Team
The best business analyst tools are the ones your team will actually use consistently. Use the criteria below to compare options on practical grounds rather than feature lists.
Selection factor | Questions to ask | What to consider |
| Project size and complexity | How many requirements and stakeholders are there? Is formal traceability needed? | Small projects suit lightweight tools. Complex or regulated work may need dedicated platforms. |
| Team size and collaboration | Who needs to view, edit, or comment? Is the team remote? | Real-time editing, permissions, and sharing options. |
| Budget and licensing | What is the total cost per user? Is there a free tier or trial? | Check current pricing, seat minimums, and feature limits before committing. |
| Integration | Does it connect to existing tools such as Jira, Microsoft 365, or Slack? | Fewer manual handoffs mean fewer errors. |
| Data security and access | Where is data stored? Who can see what? | Compliance needs, single sign-on, role-based access, and approved vendor lists. |
| Learning curve and skills | How quickly can the team become productive? | Training time, available tutorials and existing experience. |
| Methodology | Is the team Agile, Waterfall or hybrid? | Agile favours boards and backlogs. Waterfall favours structured documents and traceability. |

Two practical tips help. First, run a short pilot with a real piece of work before rolling a tool out to everyone. A two-week trial on one project reveals friction that a demo hides. Second, check whether your organisation already licenses a suitable tool. Using what is already approved avoids procurement delays and security reviews.
Finally, resist tool sprawl. Every additional product means another place to look for information. Fewer, well-integrated tools usually beat a long list of specialised ones.
Learning Order for Beginners
New analysts often ask where to begin. The sequence below is a suggestion, not a mandatory path, and your employer's stack may change the order.
- Documentation and spreadsheet fundamentals: Learn to write clear requirements and structure data in Excel. You should be able to build a simple pivot table and write a one-page requirements summary.
- Requirements gathering and backlog management: Practise writing user stories with acceptance criteria in a tool like Jira or Trello. You should be able to split an epic into stories and rank them.
- Process mapping and diagramming: Use a free tool such as draw.io to map a familiar process, like ordering a coffee, with roles and decisions.
- Data analysis and reporting: Add basic SQL and one dashboard tool. You should be able to answer a business question with a query and present it in a chart.
- Collaboration and documentation platforms: Learn to organise a Confluence-style space with clear structure and ownership.
- Prototyping and wireframing: Build a basic wireframe and walk someone through it.
- AI-assisted business analysis: Use AI to draft or summarise, then verify the result yourself.
After developing a foundation in requirements, stakeholder communication, and business analysis techniques, beginners may consider structured learning such as ECBA certification training. It is an optional pathway for building foundational knowledge. It is not required to use any of the software above, and tool skills are best built through practice on real or realistic projects.
Conclusion
Business analyst tools exist to serve the work, not the other way around. Requirements and backlog tools keep needs organised, process modelling tools reveal how work flows, collaboration platforms keep everyone aligned, data tools provide evidence, and prototyping tools test understanding early.
You do not need every product on this BA tools list. Start with the tasks your role demands, choose a small set of well-integrated tools, and build skills in the order your projects require. If you are unsure where to begin, pick a spreadsheet, a backlog tool, and a diagramming tool, then expand as your responsibilities grow.






 Lowest-Price Challenge













 Personalized Path






 USA
 Canada
 India
 UK
 Australia
 Singapore


