


 Call Us




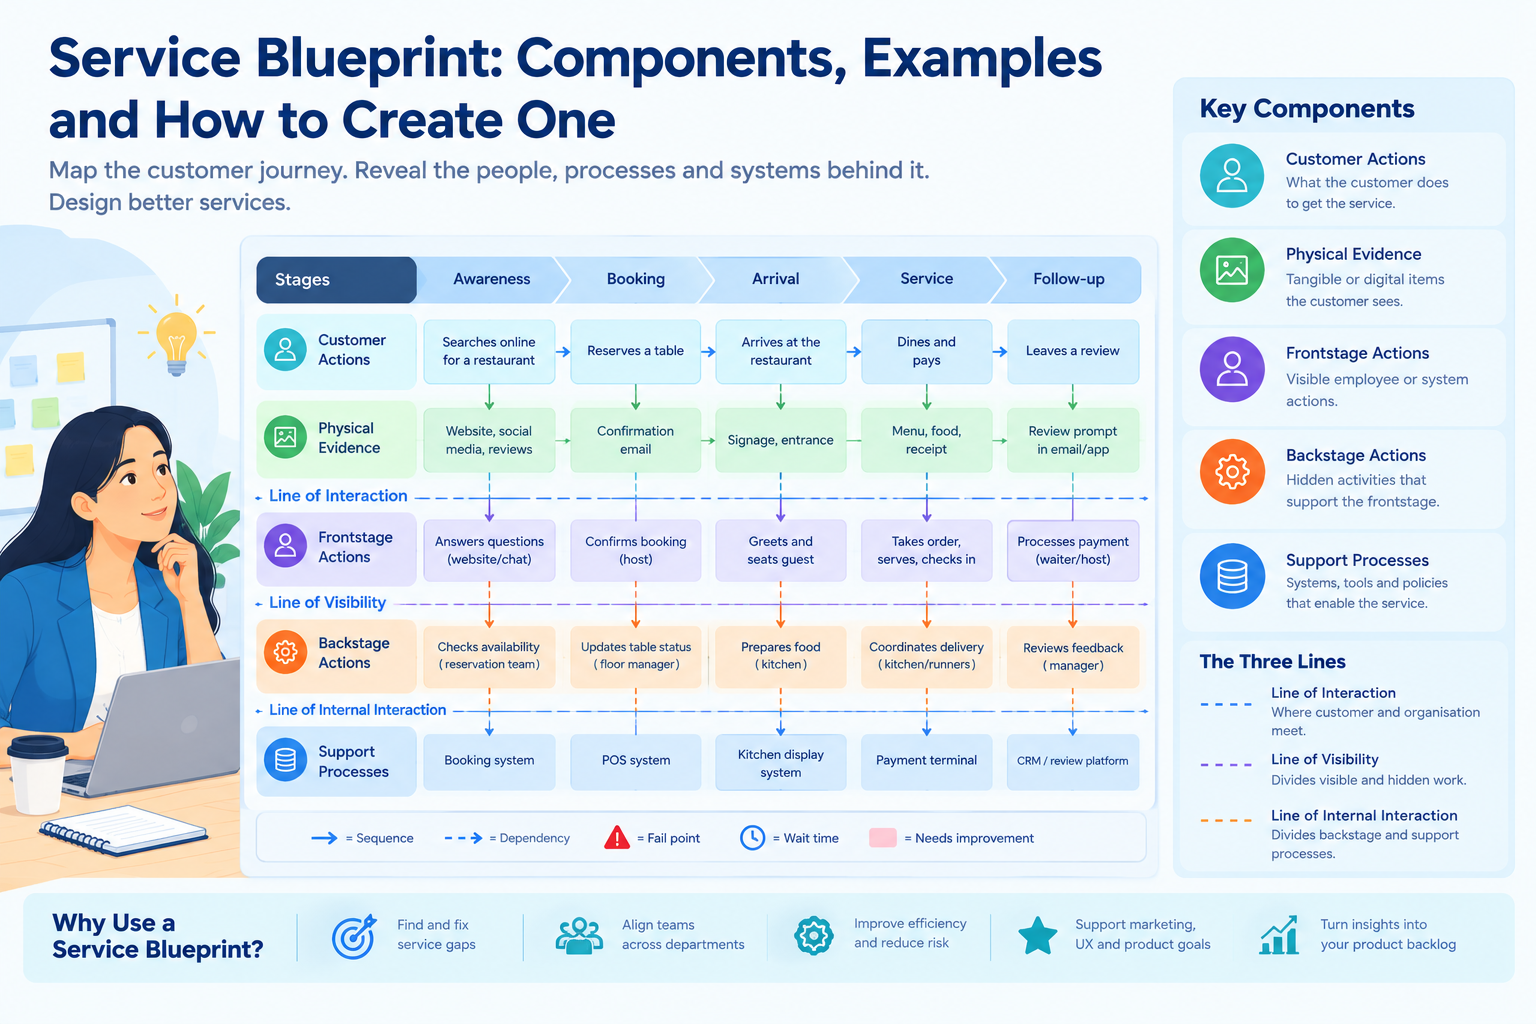
A service blueprint is a diagram that maps every step a customer takes while using a service, alongside the visible employee actions, hidden backstage work, and supporting systems that make each step possible. Its main layers are customer actions, frontstage actions, backstage actions, support processes, and physical evidence, separated by the lines of interaction and visibility.
Key Highlights of Service Blueprint
- A service blueprint is a visual map that links each customer action to the frontstage, backstage, and system work behind it.
- Its core components are customer actions, frontstage actions, backstage actions, support processes, and physical evidence, divided by three horizontal lines.
- Unlike a customer journey map, which shows the experience from the customer's side, a blueprint also exposes the operations that deliver it.
- You build one by choosing a scenario, mapping customer actions first, adding employee and system layers, and marking fail points and wait times.
- Teams use blueprints in service design, UX research, service marketing, product management, and operations improvement.
Introduction
Most customers judge a service by what they can see: the website, the person at the counter, the confirmation email. Yet each of those moments depends on work the customer never witnesses, such as a payment being verified, a table being prepared, or a record being updated in a database. When a hidden step fails, the visible experience breaks, and the team often cannot explain why, because nobody has mapped the whole chain.
That gap is exactly what a service blueprint closes. It lays the entire service out on one page, so product managers, designers, operations leaders, and frontline staff can see how the customer experience is produced, not only how it is perceived. A customer journey map is excellent for understanding how people feel at each step. A blueprint takes the same journey and adds the people, processes, and systems underneath it.
In this guide, you will learn what a service blueprint is, where it came from, what its components are, and how to build one step by step. You will read a practical service blueprint example from a restaurant and from a digital onboarding flow, and you will get a format you can adapt. Finally, you will see how blueprints support service marketing and UX, and how their findings turn into a product backlog.
What Is a Service Blueprint?
A service blueprint is a detailed diagram that shows how a service is delivered from both sides of the counter. The horizontal axis follows time, from the customer's first interaction to the final outcome. The vertical axis stacks the layers involved: what the customer does, what staff does in view of the customer, what people do out of view, and the systems, tools and policies that support all of it. Nielsen Norman Group's explanation of service blueprints describes the same core idea: a blueprint connects customer-facing moments with the organisational activity behind them.
In practice, you will also hear it called a service design blueprint, and it is one of the most widely used service design tools. Services are intangible, produced and consumed at the same time, and heavily dependent on people, so they are harder to inspect than a physical product. A blueprint makes the invisible visible. It turns a vague complaint such as 'our onboarding is slow' into a specific observation: the customer waits two days because the verification team only receives the application after a manual hand-off.
The purpose is practical. A good blueprint helps teams to:
- See the end-to-end service rather than isolated departmental tasks.
- Locate the exact step where a customer experience problem starts, even when it surfaces somewhere else.
- Assign ownership for every activity, system, and hand-off.
- Spot redundant steps, bottlenecks, and risky dependencies before redesigning anything.
- Align what marketing promises with what operations can actually deliver.
Blueprints also fit naturally with service design thinking. Where design thinking encourages empathy and iteration, the blueprint supplies the operational detail needed to make a new idea deliverable. Teams doing product discovery often use one to test whether a promising concept can really be delivered with existing people and systems.
The technique is not limited to one industry. It is used in banks, hotels, airlines, SaaS onboarding, government services and retail. A hospital service blueprint, for example, might trace a patient from appointment booking to discharge, showing the registration desk, clinical handovers, laboratory systems and billing processes that the patient never sees.
Origin and Lynn Shostack
The method traces back to Lynn Shostack, a banking executive and researcher who introduced the approach in the early 1980s. Her 1984 Harvard Business Review article, Designing Services That Deliver, argued that services were being managed by intuition because there was no precise way to describe them. Shostack proposed borrowing ideas from engineering and software to document a service as a sequence of steps, complete with the points where things could go wrong and the time each step should take.
Her most lasting contribution was the line of visibility, the divider between what customers can see and what they cannot. Later service design and service marketing researchers refined the model by adding the line of interaction, the line of internal interaction, and physical evidence. Their work helped turn blueprinting from a management idea into a standard tool for UX and service design teams.
Service Blueprint vs Customer Journey Map
Journey mapping and blueprinting are related but not interchangeable. A journey map follows the customer's steps, thoughts, and emotions. Nielsen Norman Group's guidance on customer journey mapping frames it as a visualisation of the process a person goes through to reach a goal. A blueprint keeps that journey as its top layer, then adds everything that sits beneath it.
A simple way to separate them: the journey map answers 'how does the customer experience this?', while the blueprint answers 'how does the organisation deliver it?'. Most teams get the best results by creating the journey map first to find pain points, then building the blueprint to find their causes.
Table 1: Service blueprint vs customer journey map
| Comparison factor | Service blueprint | Customer journey map |
| Primary focus | Service delivery across customer, staff and systems | The customer's experience, goals and emotions |
| Level of detail | High and operational | Medium and experiential |
| Backstage visibility | Shows backstage actions and support processes | Usually leaves them out |
| Operational processes | Included, with owners and hand-offs | Rarely included |
| Typical use | Redesigning delivery, fixing fail points, aligning teams | Understanding needs, pain points and moments of truth |
| Main audience | Operations, service design, product and IT teams | Marketing, UX and customer experience teams |
Key Components of a Service Blueprint
Every blueprint is built from five layers, arranged in horizontal lanes and separated by three lines. Reading from top to bottom moves you from what the customer experiences to the infrastructure behind it, and reading from left to right follows time. The components depend on each other: a customer action triggers a frontstage response, which relies on backstage preparation, which relies on a support process. The same lane structure appears in swimlane diagrams, which is why people who have used swimlanes find blueprints easy to pick up. The difference is that a blueprint centres the customer and adds the visibility lines. Each layer of a service design blueprint is explained below.
Customer Actions
Customer actions cover everything the customer does to obtain the service: searching, comparing options, booking, arriving, paying, asking for help and giving feedback. They form the top lane and drive the whole diagram, because every other layer exists to support these steps. Write each action from the customer's point of view and in their language, such as 'selects a table' rather than 'initiates seating workflow'. This lane is also where you record customer touchpoints, the points of contact with the business, and flag moments of truth, the decisive interactions that shape whether someone trusts you and returns. Because it mirrors a journey map, you can often lift it from existing research.
Frontstage Actions
Frontstage actions are the employee or system actions the customer can see or directly experience. A waiter taking an order, a nurse checking in a patient, a chatbot answering a question, and an app confirming a booking are all frontstage. They sit just below the customer lane, separated by the line of interaction, because this is where the customer and the organisation meet. In the frontstage and backstage distinction, this is the performance. Quality here depends on tone, speed, and consistency, so note who performs each action and through which channel, whether in person, by phone, by email, or in an app.
Backstage Actions
Backstage actions are the activities that support the frontstage but happen out of the customer's sight. A kitchen preparing a meal, a verification team reviewing documents, a pharmacist filling a prescription, and an analyst approving a refund are typical examples. They also include interactions between employees, such as a hand-over between shifts. Backstage work is where many service failures begin: late hand-offs, missing information, or unclear responsibility. Mapping it makes those weaknesses visible and shows which teams must collaborate to keep the frontstage promise.
Support Processes
Support processes are the systems, tools, policies, and internal services that enable both frontstage and backstage activity without involving the customer directly. Examples include a booking platform, payment gateway, inventory database, scheduling software, identity checks, supplier contracts and IT infrastructure. They are often owned by teams that never meet the customer, such as finance, IT, or procurement. Including them reveals dependencies and single points of failure. If the payment platform goes down, every lane above it feels the impact, even though the customer only sees a failed checkout.
Physical Evidence
Physical evidence refers to the tangible or digital items customers encounter at each step and use to judge the service. In a physical setting, this includes signage, menus, uniforms, receipts and the look of the space. In digital services, it includes web pages, emails, notifications, invoices and app screens. Because services are intangible, customers rely on this evidence to form expectations and confirm quality. Giving it its own lane, usually next to customer actions, helps teams check whether every touchpoint is consistent with the brand and with the promise that was made.
Lines of Interaction and Visibility
Three horizontal lines give the blueprint its logic. The line of interaction separates customer actions from frontstage actions and marks where the customer and the organisation directly meet. The line of visibility separates frontstage from backstage and shows what the customer can see and what stays hidden. It is the line Shostack introduced, and it helps teams decide which work should be made more transparent and which should stay invisible. The line of internal interaction separates backstage actions from support processes, showing where employees depend on shared systems and other departments. Any vertical arrow crossing a line signals a hand-off, and hand-offs are where delays and errors tend to occur.
Table 2: Key components of a service blueprint
| Component | What it represents | Restaurant example |
| Customer actions | Steps the customer takes to get the service | Books a table, orders, pays |
| Physical evidence | Tangible or digital items the customer sees | Menu, confirmation email, receipt |
| Frontstage actions | Visible employee or system actions | Host greets guest, waiter takes order |
| Backstage actions | Hidden activities that support the frontstage | Kitchen prepares dishes |
| Support processes | Systems, tools and policies that enable the work | Reservation system, POS, inventory software |
| Line of interaction | Where customer and organisation meet | Guest speaks to waiter |
| Line of visibility | Divides visible from hidden work | Dining room vs kitchen |
| Line of internal interaction | Divides backstage work from support systems | Kitchen staff vs POS and inventory tools |
How to Create a Service Blueprint Step by Step
A blueprint is a team product, not a solo design task. Before you draw anything, gather existing journey maps, user research, process documents, and complaint data. Then invite people who represent each layer: frontstage staff, backstage teams, IT, and the service or product owner. No single person understands the whole service, so a cross-functional workshop, on a whiteboard or a digital canvas, works far better than one person guessing. Use a different sticky-note colour for each lane so gaps are easy to spot.
Public-sector teams follow a similar mindset. The GOV.UK Service Manual's design guidance offers practical advice on designing services around user needs, including the operational work behind the interface. Once the group is ready, work through the four steps below.
Choose the Scenario
Start small. A blueprint of an entire organisation becomes unreadable, so choose one customer type and one scenario, for example 'a first-time customer books and receives a delivery' or 'a new user completes account verification'. Define clear start and end points, and write down the goal of the exercise. You might want to cut wait times, reduce failed hand-offs or prepare a redesign. A clear goal tells the group which level of detail matters and which can be skipped.
Map Customer Actions First
Place the customer's steps along the top in chronological order, using research rather than assumption. Include the customer's channel at each step, and add the physical evidence they encounter. Group steps into broader stages, such as awareness, booking, use and follow-up, so the diagram stays readable. Resist the urge to jump to internal processes yet. The strength of a blueprint is that every internal activity is justified by a customer step, and if you start from the organisation's side, you will map what the business does rather than what the customer needs.
Add Employee and System Layers
Work downward lane by lane. First add frontstage actions, then backstage actions, then support processes. For each customer action, ask what the customer sees, what happens out of sight to make it possible, and which system or policy it depends on. If your organisation already has process mapping documentation from operations or quality teams, reuse it here rather than starting from zero. Name an owner for each activity, draw arrows to show sequence and dependency, and mark the lines of interaction, visibility and internal interaction.
Mark Fail Points and Wait Times
Now turn the map into an analysis tool. Mark fail points, the steps where errors, rework or complaints are most likely, and note the typical wait time at each step, as Shostack originally recommended. Look especially at arrows that cross a line, since hand-offs between teams and between customer and staff are the usual trouble spots. Validate the draft with the people who do the work and, where possible, with real customers. Finally, rank the problems by customer impact and effort to fix, using a simple value vs effort matrix, so the blueprint leads to action so the blueprint leads to action rather than a poster on the wall.
Table 3: Steps to create a service blueprint
| Step | Activity | Expected output |
| 1. Choose the scenario | Select one customer type, journey and goal | Defined scope with start and end points |
| 2. Map customer actions | Sequence customer steps and evidence | Top lane of the blueprint |
| 3. Add frontstage actions | Record visible employee and system actions | Frontstage lane and line of interaction |
| 4. Add backstage and support layers | Map hidden activities, systems and owners | Backstage and support lanes with dependencies |
| 5. Mark fail points and waits | Flag risk points, delays and hand-offs | List of problem areas |
| 6. Validate and prioritise | Test with staff and customers, rank issues | Prioritised improvement list |
Service Blueprint Example
The best way to understand the method is to see it applied. The two examples below use different kinds of service: a physical restaurant visit and a digital onboarding flow. Each shows the customer action, the visible interaction, the backstage activity and the supporting process.
Restaurant Service Blueprint
Consider a casual restaurant and a first-time diner who books a table online for dinner. The scenario starts when the customer searches for somewhere to eat and ends when they leave feedback after the meal.
On the customer lane, the diner finds the restaurant, reserves a table, arrives, is seated, orders, eats, pays and later reviews the experience. The physical evidence changes at each step: the website and confirmation email, the signage and entrance, the menu, the plated food and finally the receipt.
Frontstage, the host greets the diner and confirms the reservation, the waiter explains the menu and takes the order, serves the dishes and checks in during the meal, and processes the payment. These are the moments the diner sees and judges.
Backstage, the reservation manager confirms bookings and allocates tables, the kitchen prepares each dish, the bar team prepares drinks and runners coordinate delivery. None of this is visible, but the diner feels it directly through waiting time and food quality.
The support layer includes the online reservation system, the point-of-sale (POS) system that routes orders to the kitchen, inventory software, payment terminals and the staff rota.
Now look for fail points. The first is the hand-off between waiter and kitchen: if the order is written down and re-keyed instead of sent through the POS, mistakes and delays appear. The second is the table turnover gap, when a previous party overstays and the host has no way to update the waiting guest. The longest wait sits between ordering and the first dish arriving. A journey map would record the diner's frustration at that point, but the blueprint shows the likely causes, such as ticket routing, kitchen capacity or missing stock. The full layout appears in the sample blueprint table later in this guide.
Digital Onboarding Example
The same method works for a fully digital service. Imagine a new customer opening an account in a fintech app. Instead of another table, read this one as a sequence, stage by stage.
Stage 1: Sign up: The customer downloads the app and enters personal details. Frontstage, a sign-up form with a progress indicator and a confirmation email respond. Backstage, automated duplicate and fraud checks run. Support comes from the customer database and fraud-screening engine.
Stage 2: Verify identity: The customer uploads a photo ID and a selfie. Frontstage, in-app prompts and chat support handle upload problems. Backstage, an automated document check runs, and unclear cases go to a manual review team. Support comes from the identity-verification service, a case-management tool and compliance rules.
Stage 3: Wait for approval: The customer waits and checks the app for status. Frontstage, notifications and email updates appear. Backstage, a compliance analyst approves or rejects the application and the account is created. Support comes from the core banking platform and notification service.
Stage 4: First use: The customer sets up a profile, adds funds and makes a first transaction. Frontstage, a welcome message and guided tour appear. Backstage, payment operations monitor early transactions. Support comes from the payment gateway and ledger.
The fail points are clear. Blurry uploads cause rejections in Stage 2, and the unexplained wait in Stage 3 is where customers abandon the process. The root cause sits backstage, where manual review has no service-level target and no single owner. Proactive status notifications are a quick win, while redesigning the review process is the long-term fix. Teams validating changes like this often pair blueprinting with product discovery techniques such as user interviews and prototype testing.
Service Blueprint Format and Diagram Template
A consistent service blueprint format makes the diagram easy to read, compare and reuse. Whether you draw it on a digital whiteboard, a slide or a spreadsheet, the structure stays the same, and most service design tools offer a ready-made canvas built on it. The layout below is a simple service blueprint diagram you can copy.
Follow these conventions when you adapt it:
- Lanes: keep one row per layer, in the same order every time, so readers always know where to look.
- Columns: use stages across the top, then place every activity under the stage it belongs to.
- Lines: draw the three lines as clear, labelled dividers. They are what separates a blueprint from an ordinary swimlane diagram.
- Arrows: use solid arrows for sequence and dashed arrows for dependencies between lanes.
- Markers: use a simple symbol for fail points, another for wait times, and a colour for steps that need improvement.
- Labels: write short verb-led phrases, and add an owner to every backstage and support item.
To use the template, copy the lanes into your tool, replace the placeholder stages with your own scenario, and fill the customer lane first. A good checklist before sharing: every customer action has a frontstage or system response, every frontstage action has a backstage or support dependency, and every item has an owner. If a lane is thin, you have probably missed hidden work.
Sample Service Blueprint Table
The table below applies the format to the restaurant example. It is deliberately detailed, so you can see how each layer connects across the journey and adapt it to your own service.
Table 4: Sample service blueprint for a restaurant visit
| Stage | Customer actions | Physical evidence | Frontstage actions | Backstage actions | Support processes |
| Booking | Searches online and reserves a table | Website, confirmation email | Booking page confirms slot; host answers calls | Reservation manager checks capacity and allocates table | Online reservation system, customer database |
| Arrival | Arrives and gives name | Signage, entrance, waiting area | Host greets and confirms booking | Floor manager updates table status | Table-management screen |
| Ordering | Reads menu and orders | Printed or digital menu | Waiter explains dishes and takes order | Order sent to kitchen and bar | POS system, inventory software |
| Dining | Receives food and drinks, asks for extras | Plated dishes, table setting | Waiter serves and checks in | Kitchen cooks; runners coordinate delivery | Kitchen display, staff rota |
| Payment and feedback | Requests bill, pays, leaves review | Bill, receipt, feedback prompt | Waiter brings bill and processes payment | Manager reviews feedback and reconciles takings | Payment terminal, accounting software, review platform |
Notice how the longest wait, between ordering and dining, is controlled entirely by backstage actions and support processes the diner cannot see. That is exactly the insight a blueprint is designed to surface.
Service Blueprint in Service Marketing and UX
A blueprint is not only an operations document. It is equally valuable for teams that shape how a service is promoted and designed. Here is how it supports both.
For service marketing: Service marketing extends the classic mix with people, process and physical evidence, and these map almost one-to-one onto the blueprint's lanes. Using a service blueprint in service marketing lets teams check whether the promises in campaigns and on landing pages can be kept by the people and systems behind them. It also improves blueprint customer service work, because support teams can see which backstage failures generate the complaints they handle every day.
For UX and customer experience: A service blueprint for UX extends interface-focused user experience design to the whole service, including the channels, hand-offs and offline steps around a screen. It helps teams find gaps in the customer experience that no single interface can fix, such as a perfect app that depends on a slow manual approval.
Practical benefits include:
- Clarifying every touchpoint, including customer touchpoints that are invisible in a product roadmap.
- Revealing moments of truth and the backstage work that protects them.
- Creating a shared language between marketing, design, operations and engineering.
- Prioritising improvements by showing which fixes affect the most customer steps.
Using Blueprints in UX Research
Blueprints also strengthen UX research. Before a session, the draft blueprint shows researchers which assumptions to test, such as whether customers notice a confirmation email or understand a status message. During analysis, findings can be pinned to specific steps, so a quote about a delayed refund points to the backstage review that causes it. Many teams then use user story mapping to break the improved journey into releasable slices, using the blueprint as the source of truth for what the service must do at every step.
From Service Blueprint to Product Backlog
A blueprint only creates value when its findings change something. The bridge between diagnosis and delivery is the product backlog, and the path is straightforward.
First, collect every fail point, wait time and hand-off problem from the blueprint. Second, restate each as a customer or operational problem, so the team agrees on the 'why'. Third, identify the improvement opportunity, which may be a new feature, a process change or a policy update. Fourth, convert it into a backlog item, writing a user story where the work is customer-facing. If you need a refresher on the format, see what is a user story. For example: 'As a new customer, I want to see the status of my verification so that I know how long I will wait.' Backstage and support changes can be written as technical or operational items with clear acceptance criteria.
Prioritise by combining customer impact, effort and risk. A fail point that affects many customers and is cheap to fix goes first, while a large redesign of a support system might become an epic delivered in stages. This is also where blueprint findings influence product strategy, because recurring problems in the support layer often point to a platform investment rather than a feature. A product manager usually leads this translation, working with design, operations and engineering.
Table 5: Service blueprint findings to product backlog
| Blueprint observation | Customer or operational problem | Improvement opportunity | Possible backlog item |
| Long wait between order and first dish | Guests frustrated; tables turn slowly | Automate order routing from waiter to kitchen | As a waiter, I want orders sent directly to the kitchen display so that tickets are not re-keyed |
| No update during manual identity review | Applicants abandon onboarding | Proactive status notifications | As a new customer, I want status updates so that I know when my account will be ready |
| Review team has no service-level target | Inconsistent approval times | Define and monitor review targets | Create a dashboard that tracks review time against target |
| Reservation system not linked to table status | Hosts cannot update waiting guests | Integrate booking and table management | As a host, I want live table status so that I can give accurate wait times |
Product owners who want to practise this skill in a structured way can explore CSPO certification training, which covers backlog ownership, stakeholder alignment and prioritisation.
Common Service Blueprint Mistakes
Even experienced teams make avoidable errors. Watch for these:
- Mapping only customer-facing actions: The result looks like a journey map and hides the operational causes of problems, so fixes treat symptoms instead of root causes.
- Missing backstage activities: Skipping hidden work leaves out the hand-offs where delays and errors occur, and the diagram gives a false sense of how simple the service is.
- Ignoring support systems: Without tools, data and policies on the map, teams miss dependencies and single points of failure, and later discover that a planned change breaks another team's system.
- Failing to identify ownership: If no one owns a step, no one fixes it. Unowned activities are the most common source of long waits and repeated complaints.
- Creating a blueprint that is too complicated: A diagram covering too many scenarios becomes unreadable and is quickly abandoned. Keep one persona and one scenario per blueprint.
- Not updating it when the service changes: An outdated blueprint misleads decisions. Review it after every major release, policy change or reorganisation, and treat it as a living document.
A useful safeguard is to validate each draft with the frontline staff who do the work. They will spot missing steps within minutes.
Conclusion
A service blueprint connects what customers experience with the operational work needed to deliver it. By placing customer actions, frontstage and backstage activity, support processes and physical evidence on a single timeline, it reveals fail points, wait times and ownership gaps that a journey map alone cannot show. The method is simple to start: pick one scenario, map the customer first, add each layer beneath, and mark where things go wrong.
Used well, blueprinting helps marketing keep its promises, helps UX teams see beyond the screen, and gives product owners a reliable source of backlog items. Build your first blueprint with the template in this guide, validate it with the people who deliver the service, and revisit it as the service evolves.







 Lowest-Price Challenge











 Personalized Path



.webp)


 USA
 Canada
 India
 UK
 Australia
 Singapore


